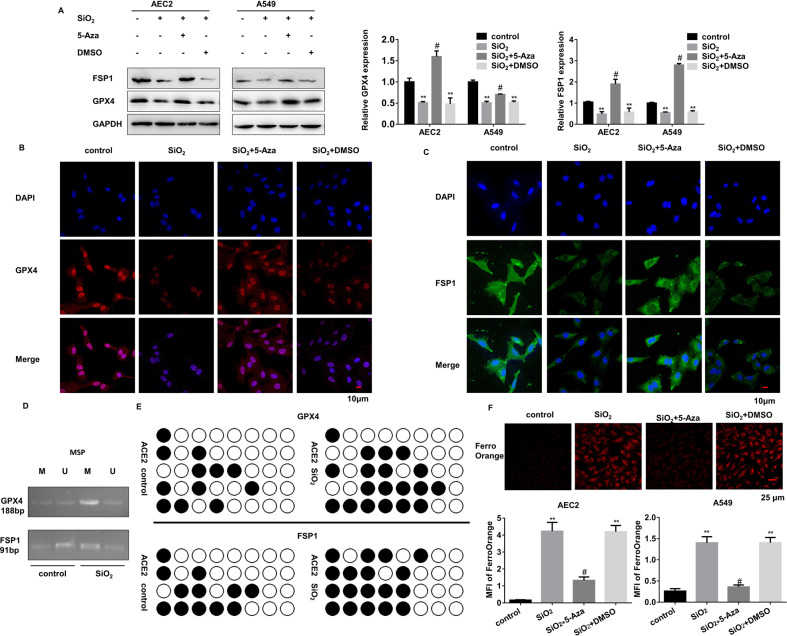
Fig. 4. DNA-methylation occurs in GPX4 and FSP1 promoter regions in SiO2-stimulated AEC2s.
Primary AEC2 and A549 cells were treated with SiO2, SiO2 + 5-Aza, and SiO2 + DMSO. A Protein levels of GPX4 and FSP1 were detected by western blot and qualified (means ± SD, n = 3) (**P < 0.01 versus control group, #P < 0.01 versus SiO2 + DMSO group). B Representative immunofluorescence staining of GPX4 (red) and C FSP1 (green) in primary AEC2 cells were shown, scale bars, 10 μm. D Methylation-specific PCR detected DNA methylation levels of ACE2 cells with or without SiO2. E DNA from control and SiO2-treated AEC2 cells were subjected to bisulfite sequencing of 5′UTR. Methylated CpG sites are shown with black circles and unmethylated sites with open circles. F Intracellular Fe2+ was detected with the FerroOrange probe, and representative images of primary AEC2 cells were shown (red: FerroOrange-stained Fe2+; scale bars, 25 µm; upper panel). Fe2+ fluorescence intensity was quantified by ImageJ in both primary AEC2 and A549 cells (**P < 0.01 versus control group, #P < 0.01 versus SiO2 + DMSO group; lower panel).

