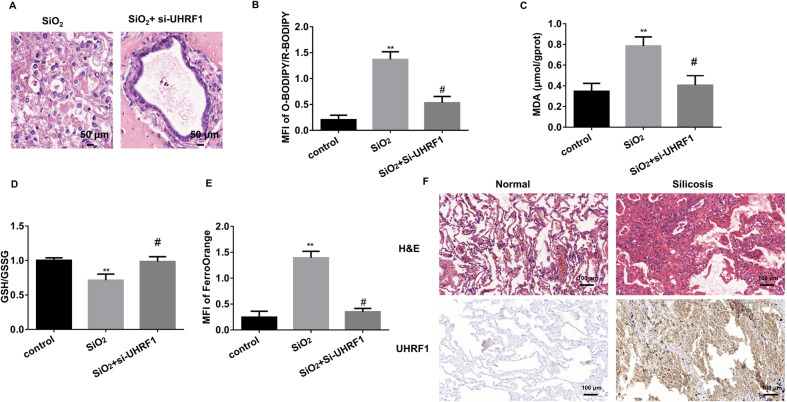
Fig. 7. AEC2 3D model confirms UHRF1-regulated ferroptosis in PF.
A Representative HE staining of primary AEC2 cell 3D culture treated by SiO2 with or without UHRF1 siRNA for 14 days. B quantification of C11-BODIPY fluorescence in primary AEC2 organoid cells (**P < 0.01 versus control group, #P < 0.01 versus SiO2-treated group). C MDA concentration in cell lysates from primary AEC2 organoid (**P < 0.01 versus control group, #P < 0.01 versus SiO2-treated group). D GSH/GSSG ratio of primary AEC2 organoid cells (**P < 0.01 versus control group, #P < 0.01 versus SiO2-treated group). E Intracellular Fe2+ fluorescence intensity was quantified in both primary AEC2 organoid cells (**P < 0.01 versus control group, #P < 0.01 versus SiO2-treated group; right panel). F Representative HE and UHRF1 IHC staining in normal and silicosis patient lung tissues (scale bars, 100 µm).

