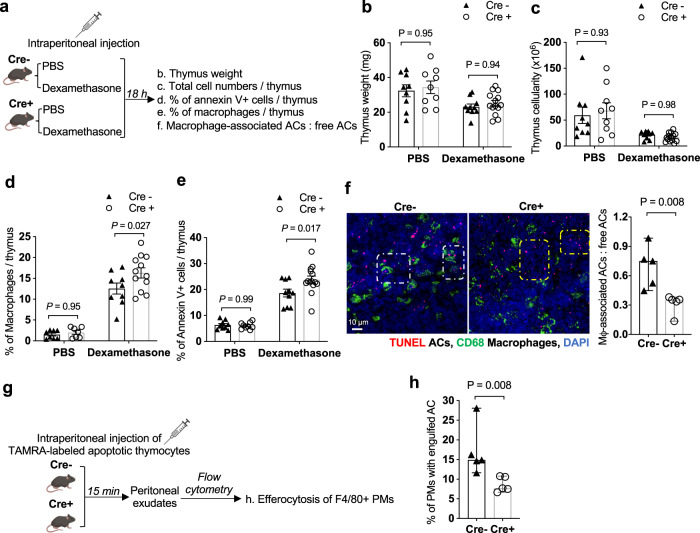
Fig. 5. Mice with myeloid Wdfy3 knockout show impaired efferocytosis in vivo.
a Schematics of experimental design for in vivo thymus efferocytosis assay. b Thymus weight. c Total number of cells per thymus. d Percentage of F4/80+ macrophages in the thymus determined by flow cytometry. e Percentage of Annexin V+ ACs per thymus determined by flow cytometry. A higher percentage implies impaired efferocytic clearance. f Thymic sections were stained with TUNEL for ACs, and CD68 for macrophages. The ratio of macrophage-associated TUNEL+ cells vs. free TUNEL+ cells was quantified and summarized. The white and yellow squares highlight the macrophage-associated and free TUNEL+ cells, respectively (n = 5 biological replicates). g Schematics of experimental design for in vivo peritoneal macrophage efferocytosis assay. h Peritoneal exudates were stained for F4/80 and the percentage of TAMRA+ peritoneal macrophages was determined by flow cytometry (n = 5 biological replicates). n = 9 Cre- and 9 Cre+ biological replicates for PBS group, n = 10 Cre− and 14 Cre+ biological replicates for Dexamethasone group in (b, c, e). n = 8 Cre− and 7 Cre+ biological replicates for PBS group, n = 9 Cre- and 12 Cre+ biological replicates for Dexamethasone group in (d). Data are presented as mean ± SEM in (b–e), as median ± 95% CI in (f) and (h). Two-sided P values were determined by a two-way ANOVA with Tukey’s multiple comparisons test in (b–e), or by Mann–Whitney test in (f) and (h).

