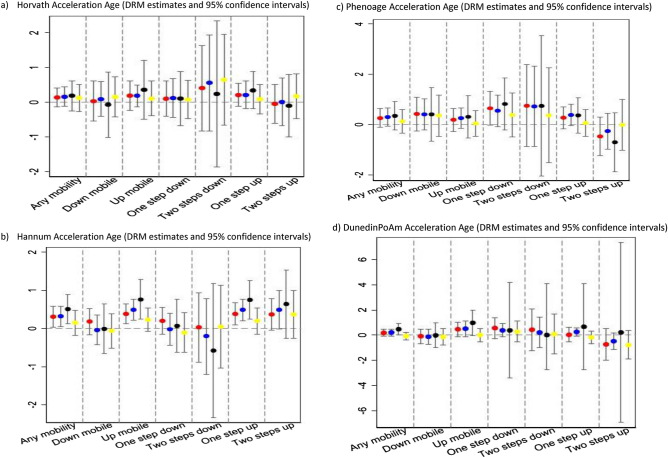
Figure 1.
DRM estimate and 95% CI of mobility variables with (a) Horvath, (b) Hannum, (c) phenoage, and (d) DunedinPoAm Acceleration Age. Point estimates from the main model (red dot), adjusted for additional covariates, marital status and educational attainment (blue dot) and stratification of the sample to those born before 1956, the median year in the study (black dot) and those born after 1956 (yellow dot). Values above 0 represent positive accelerated age, i.e. older than chronological age and values below 0 represent negative accelerated age, i.e. younger than chronological age.

