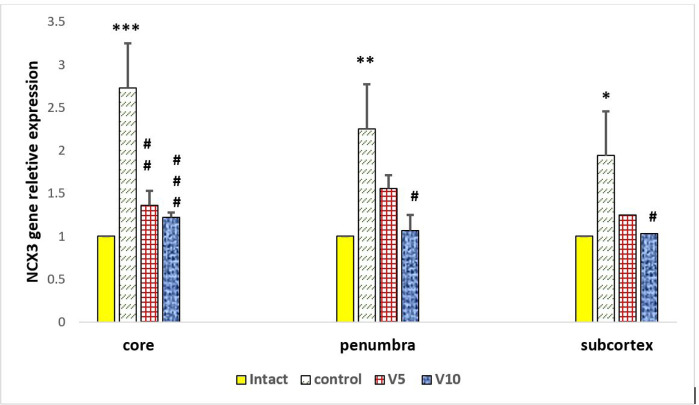
Figure 4.
Relative expression of NCX3 in the intact (Healthy Rats, n=4), control (MCAO, n=4), V5 (Viola spathulata, 5 mg/kg/d pretreatment with MCAO operation (n=4), and V10 (Viola spathulata, 10 mg/kg/d; pretreatment with MCAO operation (n=4) groups detected by Real-Time Polymerase Chain Reaction (RT-PCR)
NCX3 transcript was upregulated in the control group compared with the intact groups. NCX3 transcript was down-regulated in the V5 and V10 groups compared with the control group.
Values are presented as Means±SEM obtained from two independent experiments in the core, penumbra and subcortex areas of the brain.
*P<0.05, **P<0.01, ***P<0.001 compared with the intact group.
#P<0.05, ##P<0.01, and ###P<0.001 compared with the control group.

