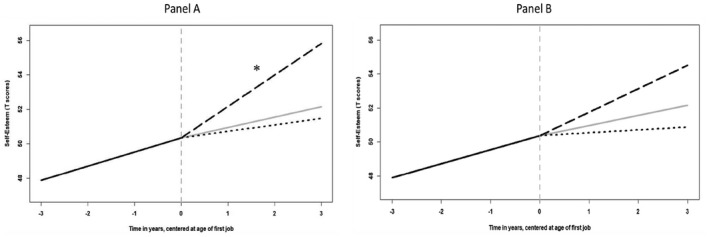
FIGURE 3.

Estimated conditional change for self‐esteem. Panel A represents trajectories for youths with low educational expectations, while Panel B represents trajectories for youths with high educational expectation. The grey dotted vertical lines represent the moment of transition to work. The grey solid lines after the transition to work represents the unconditional average trajectory. The black dashed lines represent the estimated self‐esteem change after the transition to work for college graduates (upper line). The black dotted line represents self‐esteem change estimated for non‐graduates (lower line). High and low levels of educational expectations were operationalized as 1 standard deviation above and below the mean, respectively. The asterisk indicates the significant mean slope
