
Figure 8.
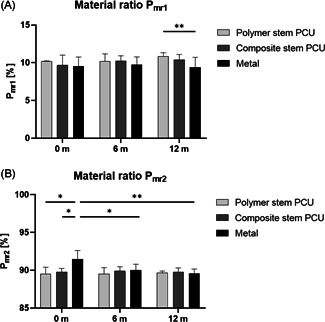
Material ratios (A) and (B) per implant type and time in vivo. n = 2 for each implant type at 0 month, n = 8 for each implant type at 6 and 12 months (*p< 0.05, **p< 0.01). PCU, polycarbonate urethane
Official websites use .gov
A
.gov website belongs to an official
government organization in the United States.
Secure .gov websites use HTTPS
A lock (
) or https:// means you've safely
connected to the .gov website. Share sensitive
information only on official, secure websites.
Material ratios (A) and (B) per implant type and time in vivo. n = 2 for each implant type at 0 month, n = 8 for each implant type at 6 and 12 months (*p< 0.05, **p< 0.01). PCU, polycarbonate urethane