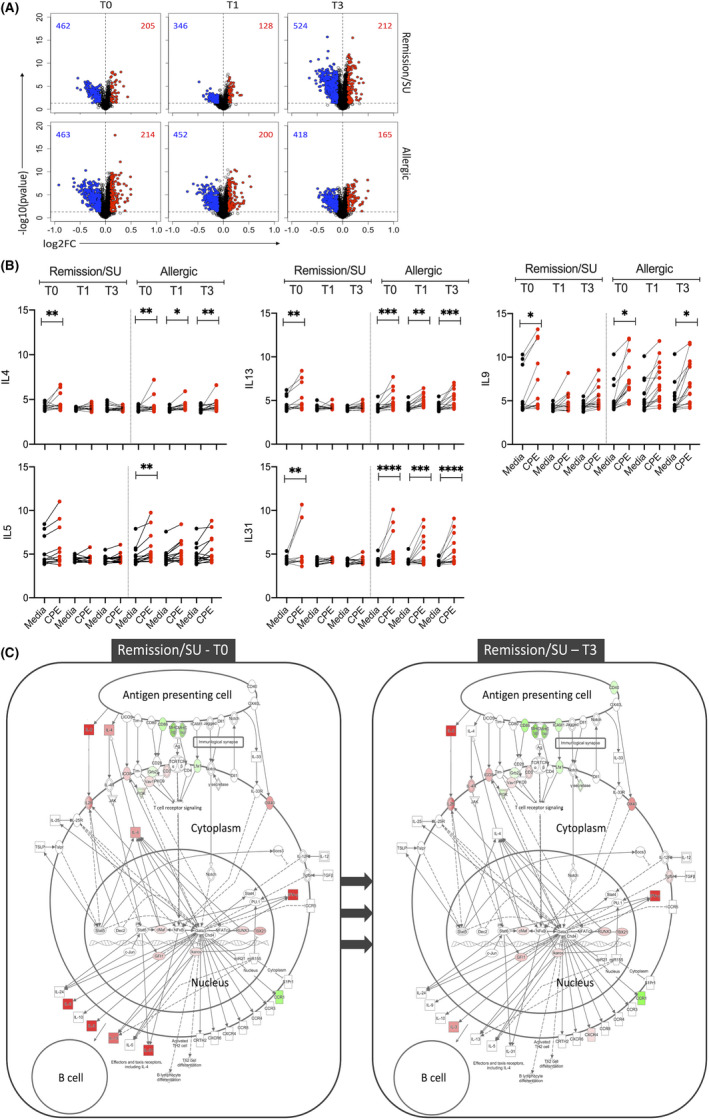
FIGURE 2.

Differential expression analysis showing peanut‐induced gene expression patterns. Differentially expressed genes (DEG) were identified with limma, employing an FDR < 0.05 and absolute log‐fold change >0.1, at T0 (study entry), T1 (end‐of‐treatment) and T3 (3‐month post‐treatment) in remission/SU and allergic groups. (A) Volcano plots of peanut‐induced DEG in remission/sustained unresponsiveness (SU) and allergic, (B) Gene expression levels of cardinal Th2 genes (IL4, IL5, IL9, IL13 and IL31) with and without peanut stimulation (CPE/Media). Significance values were obtained from limma analysis comparing CPE stimulated versus Media control, adjusted *p < 0.05, **<0.01, ***<0.001, ****<0.0001, (C) Th2 DEG were projected onto the canonical Th2 pathway employing Ingenuity pathways diagram. The data show the cellular context of where the Th2 genes operate in remission/SU at T0/T3. Th2 genes were active prior to treatment (T0) and no longer differentially expressed at T3. Red colour: upregulated and green: downregulated comparing CPE versus media control
