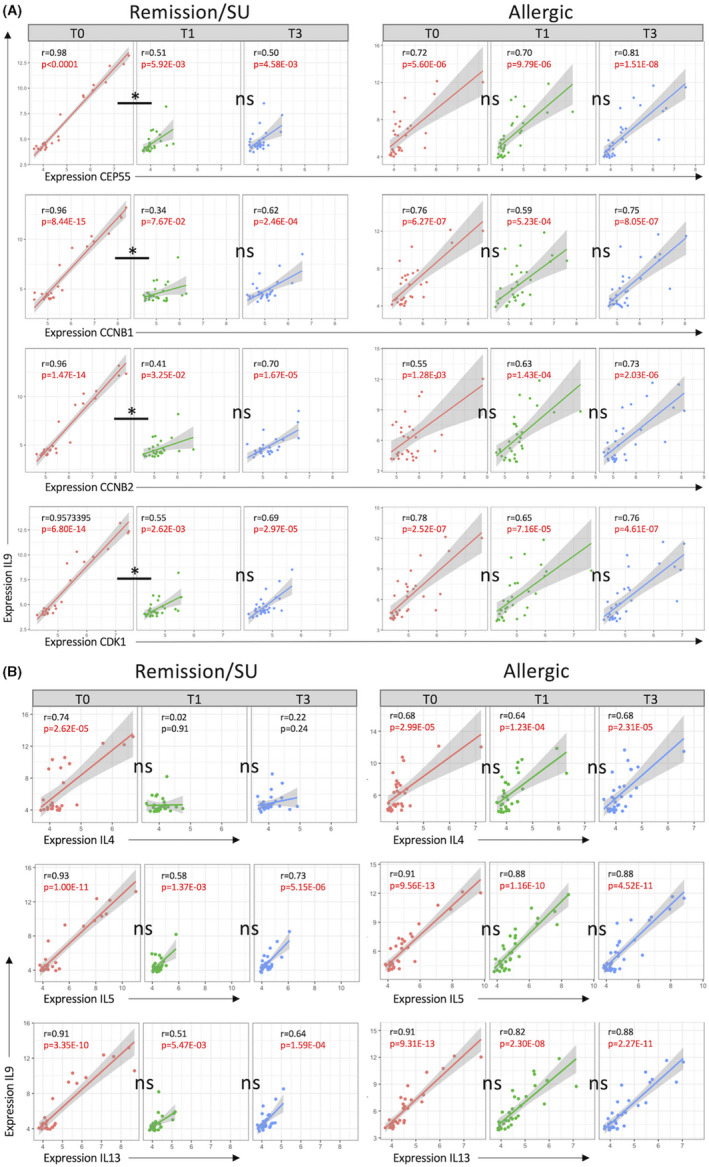
FIGURE 4.

Remission/SU is associated with loss of correlation patterns between Th2 effectors and cell cycle/proliferation. Differential gene correlation analysis (DGCA) was employed to examine gene–gene relationships (network connectivity) across time in the remission/SU and allergic groups. Pearson correlations were computed at each time point (T0, T1 and T3) and differential delta z‐scores and Benjamini–Hochberg adjusted p‐values within and across time points. (A) Th2 effector and cell cycle/proliferation gene‐gene pairs and (B) differential gene‐gene correlation for Th2 gene pairs
