
FIGURE 4.
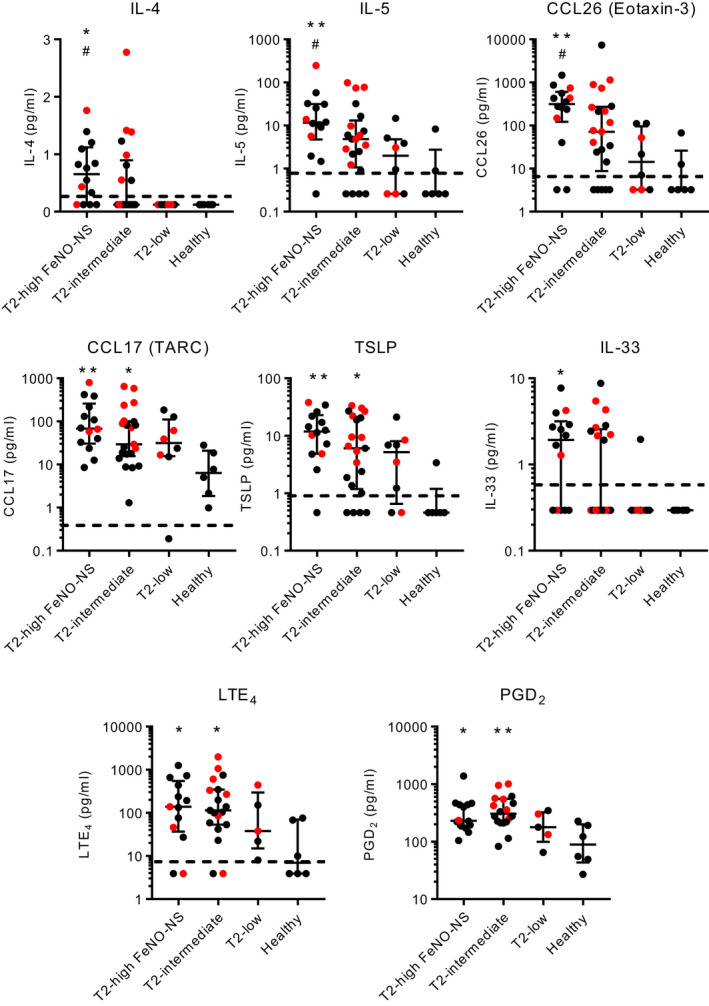
T2‐associated cytokine/chemokine, LTE4 and PGD2 concentrations in induced sputum supernatants in asthma subgroups and healthy controls. *p < 0.05, **p < 0.01, compared with healthy controls (Dunn's multiple comparison test). #p < 0.05 compared with T2‐low (Dunn's multiple comparison test). Red points represent people taking oral corticosteroids. Dotted lines represent the lower limit of detection