
Figure 3.
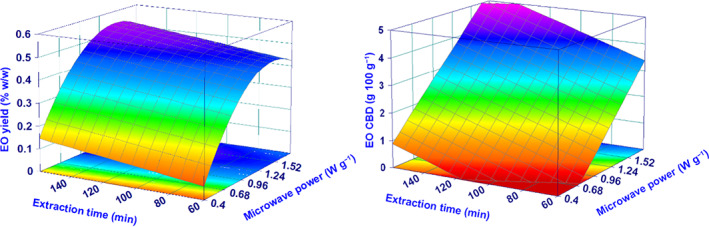
Surface plots for yield (%) and CBD concentration. The plots show the effect of microwave irradiation power and extraction time, keeping constant the added water at the coded level of 0 (the added water was never a relevant parameter for yield (%) and the CBD amount).