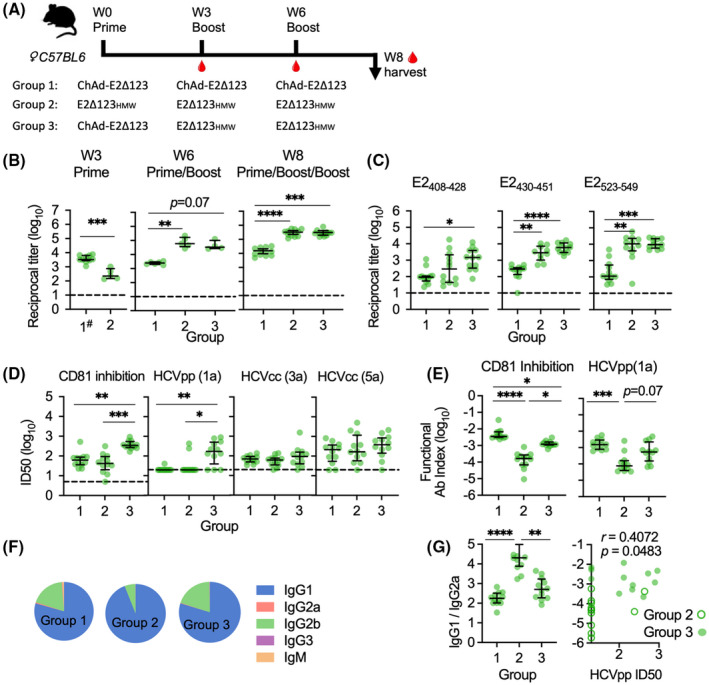
FIGURE 1.

Immunogenicity of an E2Δ123 protein sequence encoded in a ChAdOx1 prime vaccine. (A) Groups of 12 age‐matched female C57BL/6 mice were vaccinated with a prime vaccine at day 0, a boost vaccine at week 3 (W3), and another boost vaccine at week 6 (W6), followed by a terminal bleed at week 8 (W8). Group 1 had three sequential ChAd‐E2Δ123 vaccinations; group 2: three sequential E2Δ123HMW protein vaccinations; and group 3, a ChAd‐E2Δ123 prime followed by two sequential E2Δ123HMW protein boosts. ChAd‐E2Δ123 was given i.m. in the left quadricep at 108 infectious units (IU) in 40 μL sterile PBS. E2Δ123HMW (20 μg) was mixed 1:1 with 50 μL of Addavax® adjuvant and administered s.c. in the scruff ofthe neck. (B) Sera was collected at week 3 (preboost 1; hash indicates pooled groups 1 and 3), week 6 (preboost 2), and at week 8 (end of study; EOS) to determine the Ab titers’ capacity to bind gt‐1a E2Δ123 monomer in an ELISA. (C) Immune sera’s (W8, EOS) capacity to bind CD81 binding determinants: AS412 (E2408‐428); AS434 (E2430‐451); and CD81 binding loop (E2523‐549). ELISA Ab titers were measured at 10 times background (BSA), using dilution curves, and are plotted as log reciprocal titers. (D) EOS immune sera titers that inhibit 50% (ID50) of: E2 binding to CD81; neutralizing HCV gt‐1a HCVpp; and HCV gt‐3a and ‐5a HCVcc virion entry into Huh7.5 cells. ID50 inhibitory titers were determined using a dilution curve where the vaccine‐induced Ab response was background subtracted and standardized to a negative control, which displayed 100% binding/entry (e.g., BSA, instead of immune sera, incubated with E2 or HCVpp/cc before determining CD81 binding or cell infectivity). (E) ID50 inhibitory titer of immune sera as a function of the overall Ab titer, displayed as Ab titer divided by ID50 titer. (F) EOS E2‐specific Ab isotype titers are displayed as a fraction of the total Ab titer (median pie base). (G) IgG2a titer of immune sera was calculated as a function of the IgG1 titer and is displayed as IgG1 titer divided by IgG2a titer (IgG1/IgG2a). The lower the titer, the closer the IgG2a to IgG1 ratio is to 1:1, indicative of IgG1 to IgG2a class switching. The reciprocal titer (1/IgG1:IgG2a) was plotted against the HCVpp ID50 titer for immune sera from animals that received C/P/P and P/P/P to determine any correlation. All bars are medians, and interquartile ranges are displayed. For Panel B–D, the dashed line is the cutoff for detectable responses. The D’Agostino and Pearson test was used to determine normality of data distribution, and Mann‐Whitney U tests were performed to determine significant differences between two group medians at a 95% CI (Kruskal‐Wallis test for multiple groups). p values indicate a significant difference between groups when: *p < 0.05; **p < 0.01; ***p < 0.001; ****p < 0.0001
