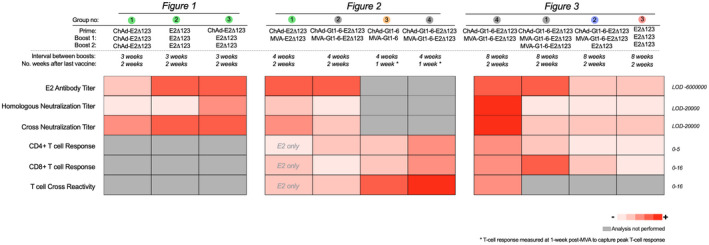
FIGURE 4.

Summary of vaccination regimens. Comparison of 11 different vaccination regimens based on their immunogenicity, shown as a summary of presented data in Figures 1, 2, 3. Heatmap was generated using the median response for each assay. E2 antibody titer: titer of immune serum generated to bind soluble E2Δ123 monomer. Homologous neutralization titer: ID50 titer that neutralizes gt‐1a HCVpp. Cross‐neutralization titer: the ID50 titer to neutralize gt‐3a and ‐5a HCVcc. CD4+ and CD8+ T‐cell response: frequency of gt‐1a IFNγ+ CD4+ or CD8+ T cells as a percentage of total CD4+ or CD8+ T‐cell (CD3+) frequencies. T‐cell cross‐reactivity: the frequency of all non‐gt‐1a (i.e., gt‐1b and/or ‐3a) IFNγ+ CD4+ or CD8+ T cells as a percentage of total CD4+ or CD8+ T‐cell (CD3+) frequencies. The scale represents a low median response (pink) to high median response (red), with numbering to the right of the chart indicating the highest and lowest values for each analysis. Gray represents analysis that was not performed for that regimen. LOD, limit of detection
