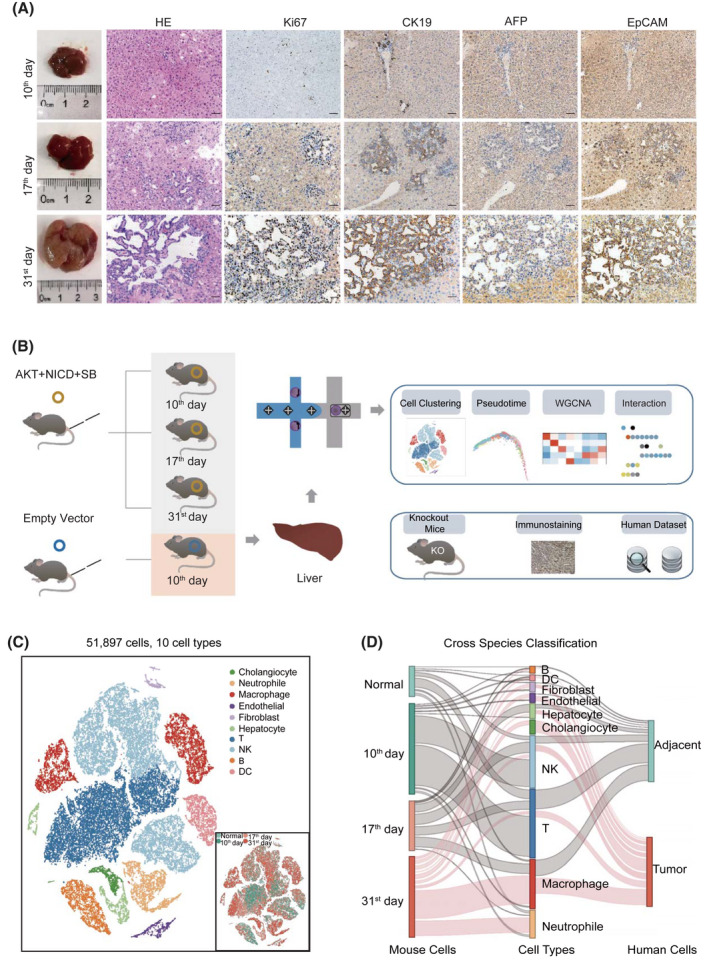
FIGURE 1.

Transcriptomic profiling of AKT/Notch intracellular domain (NICD)–induced intrahepatic cholangiocarcinoma (ICC) in mice. (A) Hematoxylin and eosin (HE) staining and immunohistochemistry of mouse liver tissues collected on days 10, 17, and 31 after AKT/NICD plasmid injection. Scale bars represent 50 μm. (B) Overview of the study design. (C) The t‐distributed stochastic neighbor embedding (t‐SNE) visualization of 51,897 cells from nine mouse ICC samples. Clusters and sample origins are distinguished by colors. (D) Comparison of cellular profiles between human and mouse ICC data (Sankey diagram). The height of each linkage line reflects the number of cells. The red line between cell types and two data sets represents the ICC cells from mice collected on day 31 and those from human samples. AFP, alpha‐fetoprotein; EpCAM, epithelial cell adhesion molecule; KO, knockout; SB, sleeping beauty transposase; WGCNA, weighted correlation network analysis
