FIGURE 2.

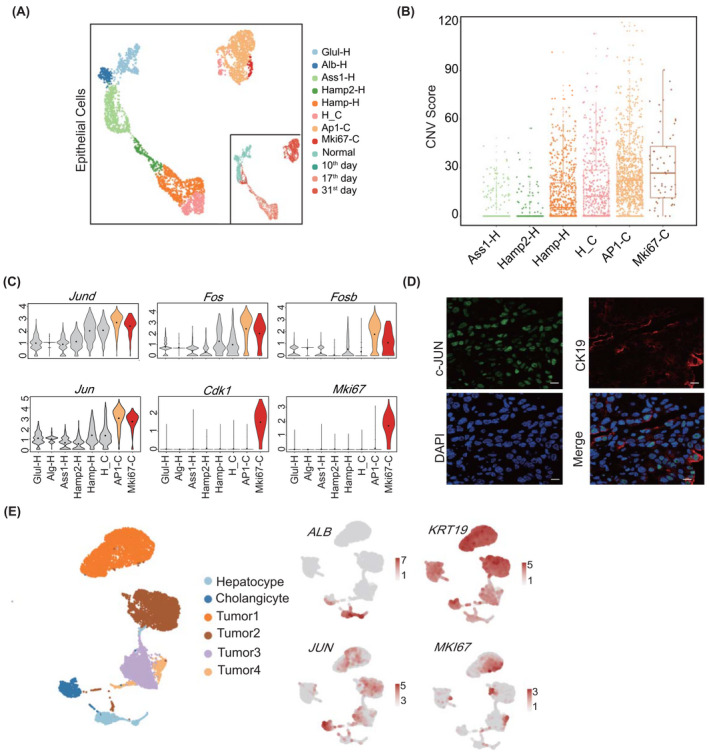
Cellular heterogeneity of ICC tissues at different stages. (A) Eight subtypes in liver epithelial cells illustrated using uniform manifold approximation and projection (UAMP) plots and indicated with different colors. Sample origins are distinguished by colors as shown on the right bottom. (B) Copy number variation (CNV) box plots for distinct epithelial cell subtypes, indicating the malignant subtypes AP1‐C and Mki67‐C. For the boxplot, the centerline represents the median; box limits represent upper and lower quartiles; and whiskers represent the data range. (C) Violin plots showing the expression of marker genes in distinct malignant subtypes. (D) Immunofluorescence of c‐Jun (jun proto‐oncogene, Jun) in mice cells collected on day 31. The scale bars represent 10 µm. (E) Validating the two ICC subtypes in human ICC epithelial cells, the color from gray to red represents the expression level from low to high. ALB, albumin; Alb‐H, Alb positive hepatocyte; AP1‐C, AP1 positive cholangiocyte; Ass1‐H, Ass1 positive hepatocyte; Cdk1, cyclin‐dependent kinase 1; CK19, keratin 19 (Krt19); DAPI, 4′,6‐diamidino‐2‐phenylindole; Fos, FBJ osteosarcoma oncogene; Fosb, FBJ osteosarcoma oncogene B; Glul‐H, Glul positive hepatocyte; Hamp‐H, Hamp positive hepatocyte; H_C, cells with hepatocyte and cholangiocyte markers; Hamp2‐H, Hamp2 positive hepatocyte; Jund, jun D proto‐oncogene; Mki67, antigen identified by monoclonal antibody Ki67; Mki67‐C, Mki67 positive cholangiocyte
