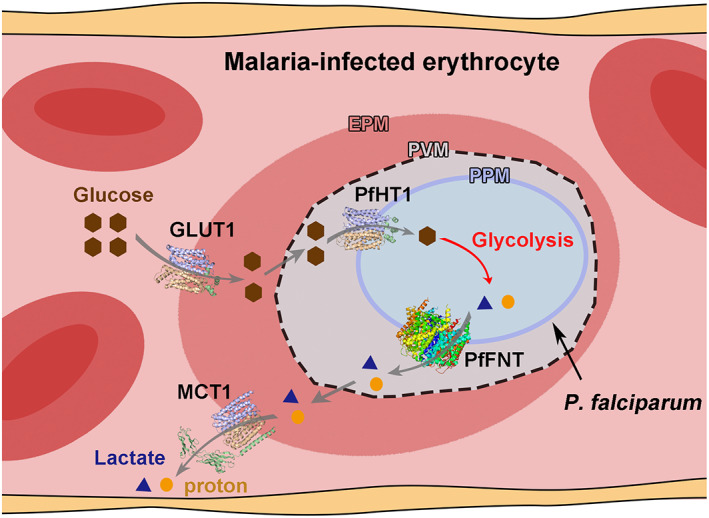
FIGURE 1.

Schematic diagram for the glucose uptake and metabolism of the asexual blood‐stage P. falciparum. Three membrane model of the malaria‐infected erythrocytes. The NPP on EPM and the duct and TVM on PVM are omitted. Glucose and lactate are represented by brown hexagons and blue triangles, respectively. Protons are presented as orange circles. The PDB codes for the GLUT1, PfHT1, PfFNT, and MCT1 structures are 4PYP, 6M20, 7E26, and 6LZ0, respectively. All structure figures were prepared with PyMOL
