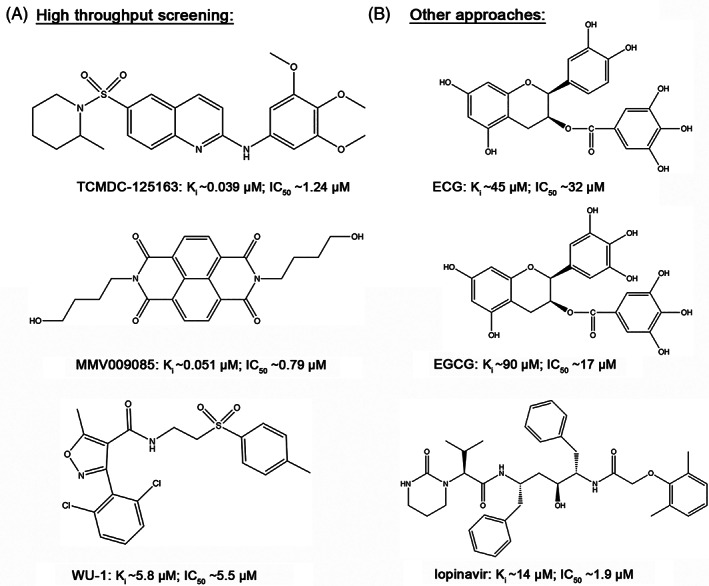
FIGURE 5.

Representative compounds obtained from HTS and other approaches. Chemical structures of the representative compounds obtained from high‐throughput screening (A) and other approaches (B). The Ki represents the inhibition constant of PfHT1‐mediated d‐glucose/2‐DOG uptake. The IC50 represents the inhibition constant of P. falciparum 3D7 growth. Notably, the measurements of Ki and IC50 may vary in different research studies
