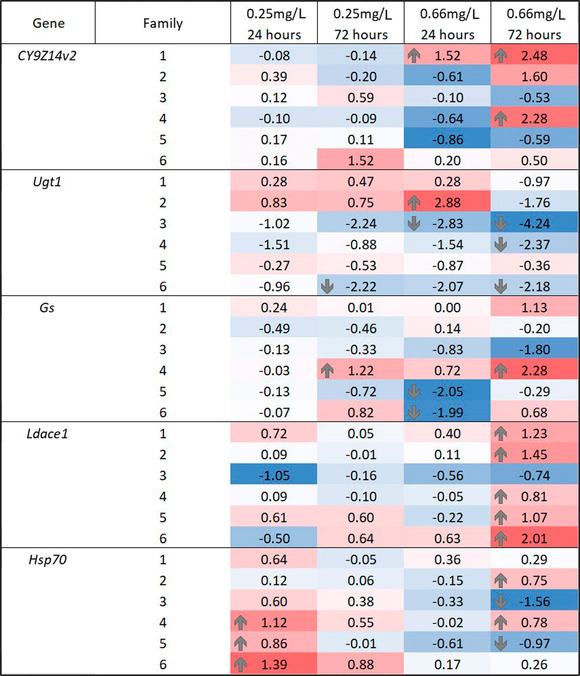
Fig. 3.

Fold changes (log2 transformed) of the 5 target genes (CYP9Z14v2, Ugt1, Gs, Ldace1, Hsp70) when compared to the control (nontreated) sample (n = 5) under 4 treatments (24‐h and 72‐h exposure to 0.25 mg/L and to 0.66 mg/L of fluazinam) in 6 Colorado potato beetle (CBP) families. Expression levels of the study genes were normalized using L13e and RpS18 reference genes. Red color and positive values denote upregulation and blue and negative values indicate downregulation. Numbers from 1 to 6 indicate the 6 different families used in the study. Intensity of the color indicates the level of expression, and families with significant differences (collected from REST, see text for details) between the control and the treatment groups are marked with upward or downward arrows.
