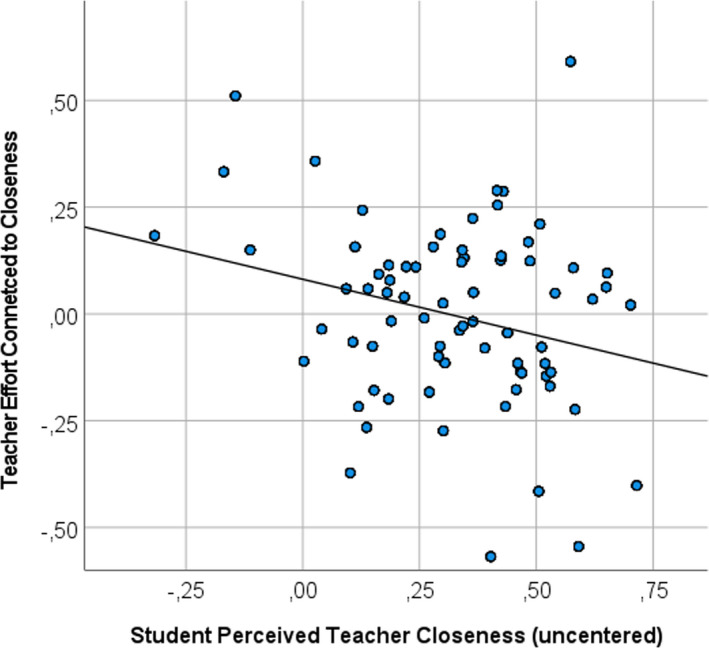
FIGURE 2.

Teacher effort connected to closeness (observational data) plotted against general student perceptions of teacher closeness. Note. The correlation between student perceived teacher closeness (x‐axis) and teacher effort connected to being close (i.e., the cross‐correlation; y‐axis) was r = −.25. The y‐axis reflects the intra‐individual cross‐correlation between the time series of a teacher's heart rate and a teacher's closeness during teaching
