
Fig. 2.
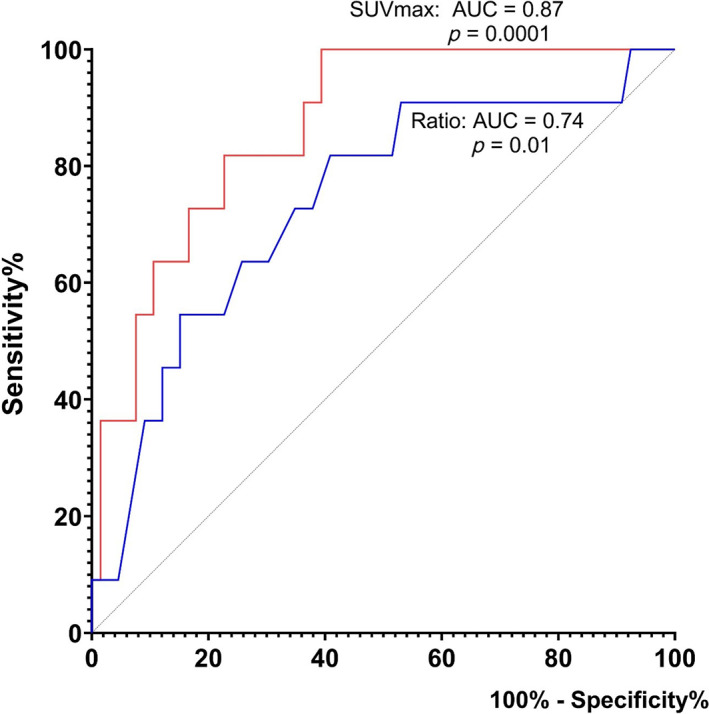
ROC curve analyses of absolute SUVmax values (red) and SUVmax ratio between tonsils (blue) as predictors of malignancy in the patient group. ROC, receiver operating characteristic curve; SUVmax, maximum standardized uptake values; AUC, area under the curve. [Color figure can be viewed in the online issue, which is available at www.laryngoscope.com.]