
FIGURE 2.
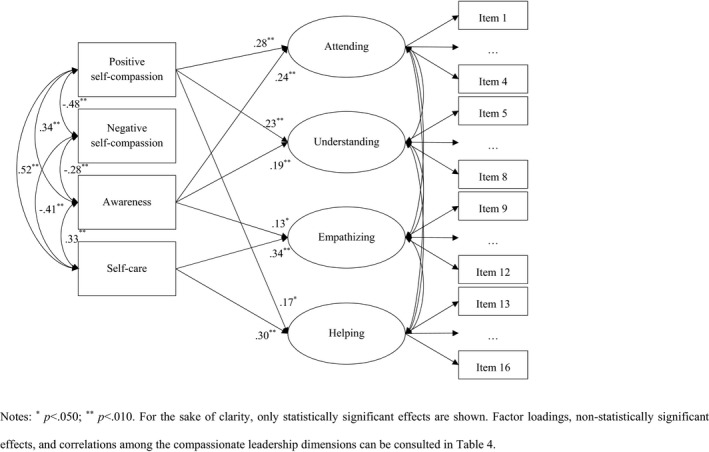
MIMIC results. Notes: * p < 0.050; ** p < 0.010. For the sake of clarity, only statistically significant effects are shown. Factor loadings, non‐statistically significant effects and correlations among the compassionate leadership dimensions can be consulted in Table 4