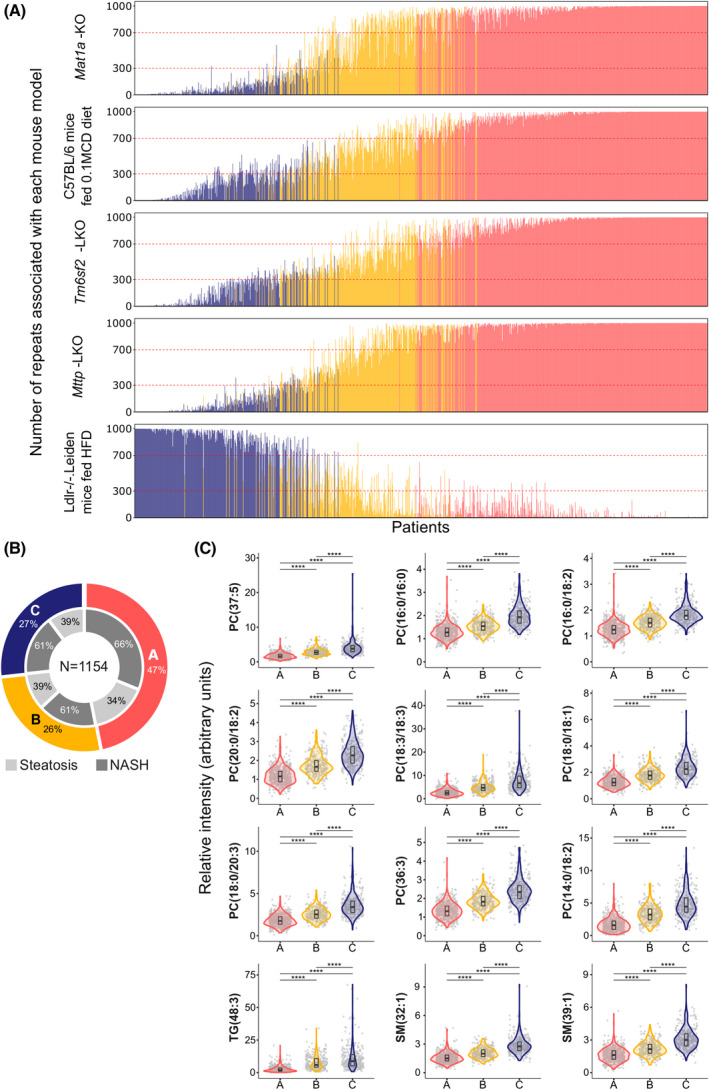
FIGURE 1.

Classification of patients with NAFLD (n = 1242) into subtypes. (A) The frequency distribution of the patients with NAFLD (n = 1154) according to five mouse models of NAFLD. Frequencies were obtained after (1) random patient partition (50/50) into two cohorts with equal proportional representation of nonalcoholic fatty liver (NAFL)/NASH and males/females; (2) clustering analysis based on the 50 more significantly serum metabolites that differentiated more significantly between the mouse model of NAFLD and the respective control mice; (3) 1000‐fold repetition of the random partition with equal representation of NAFL/NASH and males/females. Representation of the number of repeats associated with methionine adenosyltransferase 1A knockout (Mat1a‐KO) mice, C57BL/6 mice fed 0.1% methionine and choline deficient diet (0.1MCD), liver‐specific microsomal triglyceride transfer protein KO (Mttp‐LKO), liver‐specific transmembrane 6 superfamily member 2 KO (Tm6sf2‐LKO), and germline Ldlr‐deficient (Ldlr−/−.Leiden) KO mice fed high‐fat diet (HFD). Patients with a frequency over 70% for Mat1a‐KO, 0.1MCD, Mttp‐LKO and Tm6sf2‐LKO, and lower than 70% for Ldlr−/−.Leiden/HFD, were classified as subtype A (colored in red). Patients with a frequency lower than 70% for Mat1a‐KO, 0.1MCD, Mttp‐LKO and Tms6f2‐LKO, and higher than 70% for the Ldlr−/−.Leiden/HFD, were classified as subtype C (colored in blue). Patients not classified as either subtype A or C were classified as subtype B (colored in yellow). (B) Percentage of patients classified as subtypes A, B, and C. Percentage of patients with NAFL and NASH per subtype is also indicated. (C) Serum levels of lipids that discriminate among NAFLD subtypes A, B, and C. Gray points in the background indicate the real values with a minimal random displacement to avoid overplotting. Densities are represented as violin plots, while main distributions (medians and first and third quartiles) are represented as internal box plots. Horizontal black lines are statistical comparisons (t test) between two groups, with the unadjusted p values as symbols above the lines (****p < 0.0001; ***p < 0.001; **p < 0.01; *p < 0.05; ns, ≥ 0.05). ns, not significant; PC, phosphatidylcholine; SM, sphingomyelin; TG, triglycerides
