FIGURE 3.

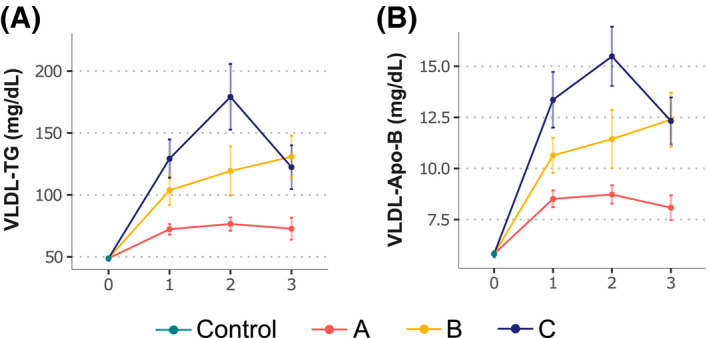
VLDL‐TG and VLDL‐Apo‐B concentration by grade of steatosis for each NAFLD subtype and control cohort. (A,B) Total VLDL‐TG (A) and VLDL‐Apo‐B (B). Values are represented as means (points) and standard errors (vertical lines)

VLDL‐TG and VLDL‐Apo‐B concentration by grade of steatosis for each NAFLD subtype and control cohort. (A,B) Total VLDL‐TG (A) and VLDL‐Apo‐B (B). Values are represented as means (points) and standard errors (vertical lines)