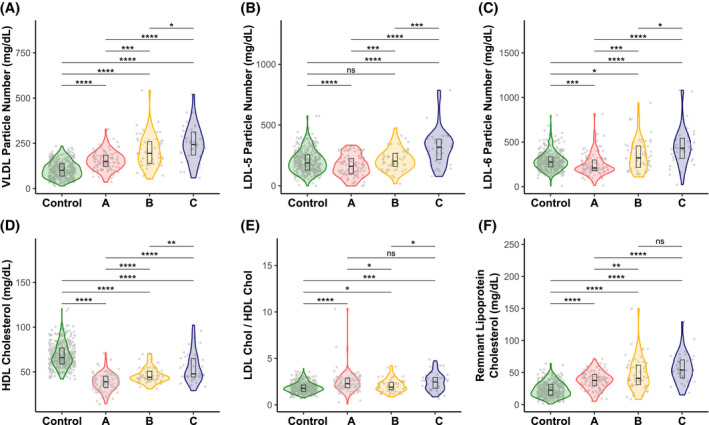
FIGURE 4.

Blood lipoprotein particle numbers and cholesterol concentrations for NAFLD subtypes (A, B, and C) and control subjects. (A) VLDL particle number. (B) LDL‐5 particle number. (C) LDL‐6 particle number. (D) HDL cholesterol. (E) LDL cholesterol/HDL cholesterol ratio. (F) Remnant lipoprotein cholesterol. Gray points in the background indicate the real values with a minimal random displacement to avoid overplotting. Densities are represented as violin plots, while main distributions (medians and first and third quartiles) are represented as internal box plots. Horizontal black lines are statistical comparisons (t test) between two groups, with the unadjusted p values as symbols above the lines (****p < 0.0001; ***p < 0.001; **p < 0.01; *p < 0.05; ns, ≥ 0.05)
