
FIGURE 3.
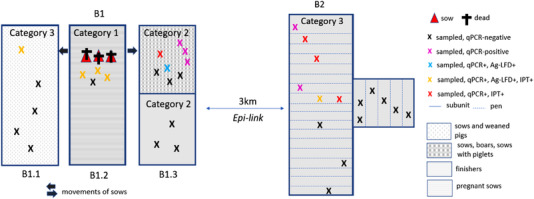
Schematic view of farm B with sampling units (B1.1, B1.2, B1.3, and B2) and results of testing
Official websites use .gov
A
.gov website belongs to an official
government organization in the United States.
Secure .gov websites use HTTPS
A lock (
) or https:// means you've safely
connected to the .gov website. Share sensitive
information only on official, secure websites.
Schematic view of farm B with sampling units (B1.1, B1.2, B1.3, and B2) and results of testing