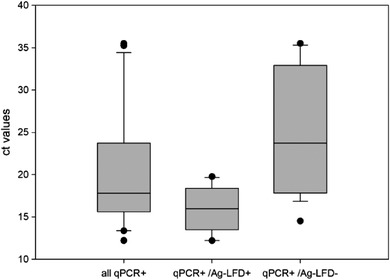
FIGURE 5.

Comparison of Ct‐values for all tested blood samples, samples that were qPCR and Ag‐LFD positive and samples that were qPCR positive but Ag‐LFD negative. The boundaries of the boxes indicate the 25th and 75th percentiles, and the line within the box marks the median
