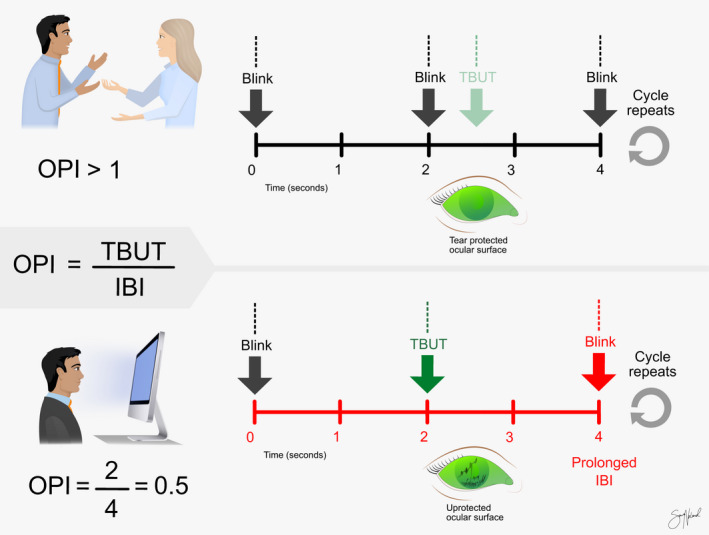
Fig. 2.

Illustration of the ocular protection index (OPI). The OPI is calculated by dividing the tear film break‐up time (TBUT) by the inter‐blink interval (IBI). In this illustration, two scenarios are presented: blinking during normal conversation (above) and during video display terminal (VDT) use (below). During a normal conversation, the IBI is generally shorter than, or close to, TBUT, due to high blink rates, making OPI closer to 1. During VDT use, IBI increases, and TBUT decreases, reducing the OPI and yielding an unprotected ocular surface. Copyright Sara T. Nøland. [Colour figure can be viewed at wileyonlinelibrary.com]
