
FIGURE 4.
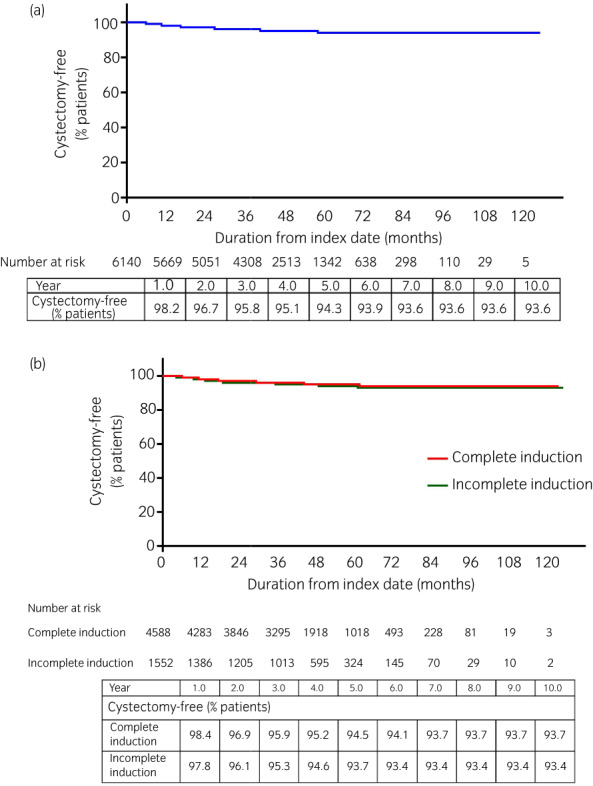
Kaplan–Meier curves of time from first intravesical BCG prescription to cystectomy in the (a) overall cohort, and (b) complete‐ and incomplete‐induction cohorts. [Colour figure can be viewed at wileyonlinelibrary.com]
Official websites use .gov
A
.gov website belongs to an official
government organization in the United States.
Secure .gov websites use HTTPS
A lock (
) or https:// means you've safely
connected to the .gov website. Share sensitive
information only on official, secure websites.
Kaplan–Meier curves of time from first intravesical BCG prescription to cystectomy in the (a) overall cohort, and (b) complete‐ and incomplete‐induction cohorts. [Colour figure can be viewed at wileyonlinelibrary.com]