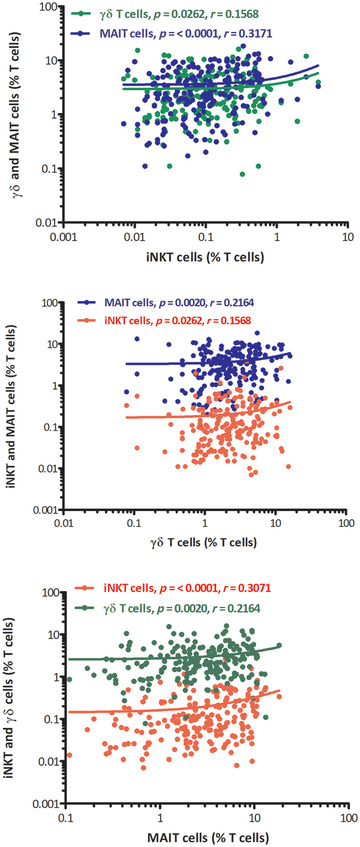
FIGURE 5.

Correlation between percentages of iNKT cells, γδ T cells, and MAIT cells altogether in peripheral blood of healthy adult samples. x‐axis represents unconventional T cells and y‐axis represents % of unconventional T cells among T cells. The p values and Spearman's rank correlation coefficients of each correlation are indicated within the graphics separately
