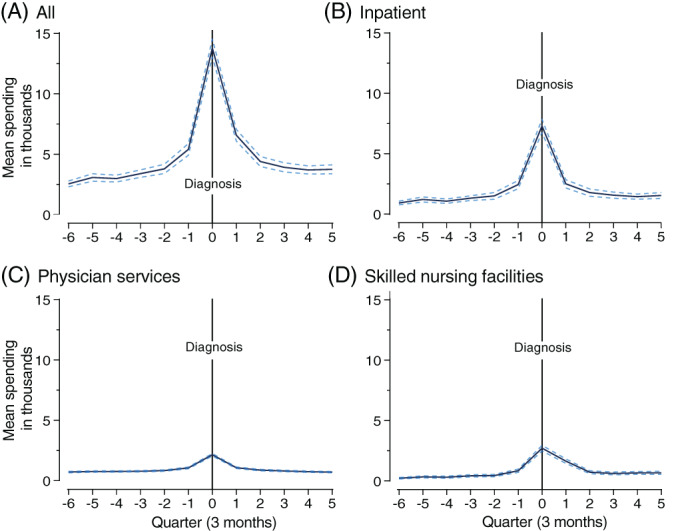
FIGURE 1.

Caption: Spending changes, overall and by treatment setting, before and after an ADRD diagnosis for older (≥65) Medicare beneficiaries. Legend: Dotted lines indicate 95% confidence intervals. Quarter 7 (Q7) is the quarter in which ADRD was diagnosed clinically. Two‐part models were estimated, adjusting for sociodemographic, health, and functional status characteristics
