FIGURE 2.

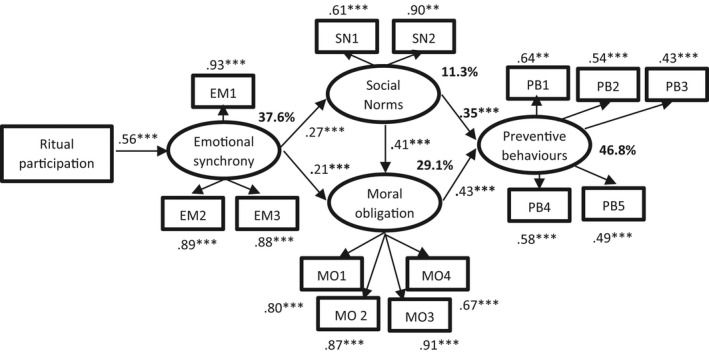
Predictors of preventive behaviours in Study 1 (general population). Standardised estimations for the measurement model. ***p < .001. Control variables (age and gender) included in the analysis but not visible in the figure

Predictors of preventive behaviours in Study 1 (general population). Standardised estimations for the measurement model. ***p < .001. Control variables (age and gender) included in the analysis but not visible in the figure