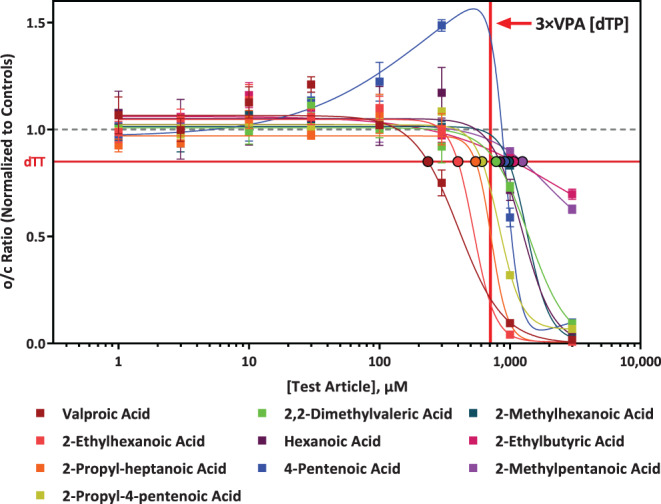
FIGURE 3.

Comparison of valproic acid (VPA) analogue response in the devTOX quickPredict assay. The x‐axis is the analogue concentration (μM) of the test article and the y‐axis is the vehicle‐treatment normalized (fold change) values for the o/c ratio of each analogue. The horizontal red line represents the developmental toxicity threshold (0.85), the dashed horizontal gray line represents 1.0. The vertical red line indicated the concentration that is three times more than the developmental toxicity potential (dTP) concentration of VPA. The solid squares are mean values and error bars are the standard error of the mean. If not shown, error bars are smaller than the size of the symbol. The black outlined circles of various colors indicate the dTP concentrations for the corresponding analogue.
