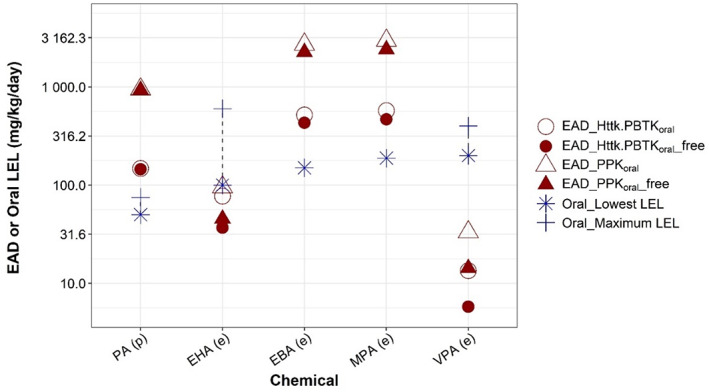
FIGURE 4.

Comparison of equivalent administered doses (EADs) to oral rat lowest effect levels (LELs) for selected valproic acid analogues. The figure represents data provided in Table 3. EAD values predicted from devTOX quickPredict assay nominal developmental toxicity potential concentrations (open symbols) and free medium concentration (filled symbols) using one‐compartment population‐based pharmacokinetic (triangles) or httk.PBTK model (circles) are compared to the lowest and highest rat LELs (star and cross, respectively). Dashed lines highlight the range from lowest to highest in vivo LELs. The chemicals are ordered based on their lowest LELs, from low (left) to high (right). Whether predicted (p) or experimental (e) Clint values were used to generate EAD is indicated parenthetically on x‐axis labels.
