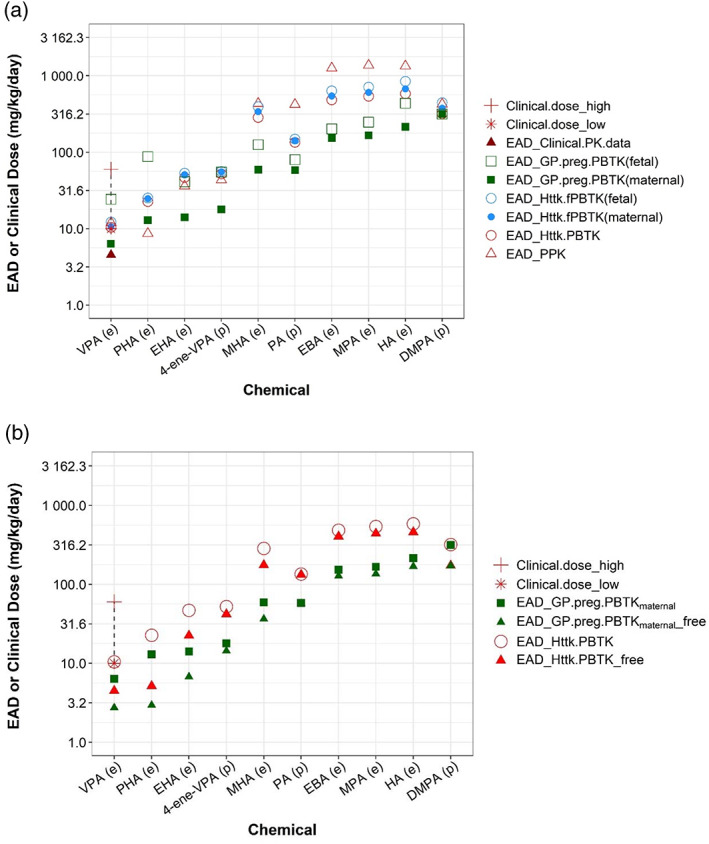
FIGURE 5.

Human equivalent administered doses (EADs) estimated from various pharmacokinetic (PK)/physiologically based PK (PBPK) models. (a) Human EAD values estimated from nominal developmental toxicity potential (dTP) concentrations using various PK models (circles and squares) and clinical PK data were presented with different symbols. (b) Human EAD estimates between using free and nominal dTP concentration were compared for selected PK models. The chemicals are ordered from left to right based on lowest EAD values from low to high. Letters “(e)” or “(p)” on x‐axis labels indicate, respectively, whether experimental or quantitative structure‐activity relationship‐predicted Clint values were used to parameterize a PK model. For valproic acid, the dashed line highlights the range from lowest (“*”) to highest (“+”) clinical dose. Data for both figures are provided in Table S5.
