
FIGURE 4.
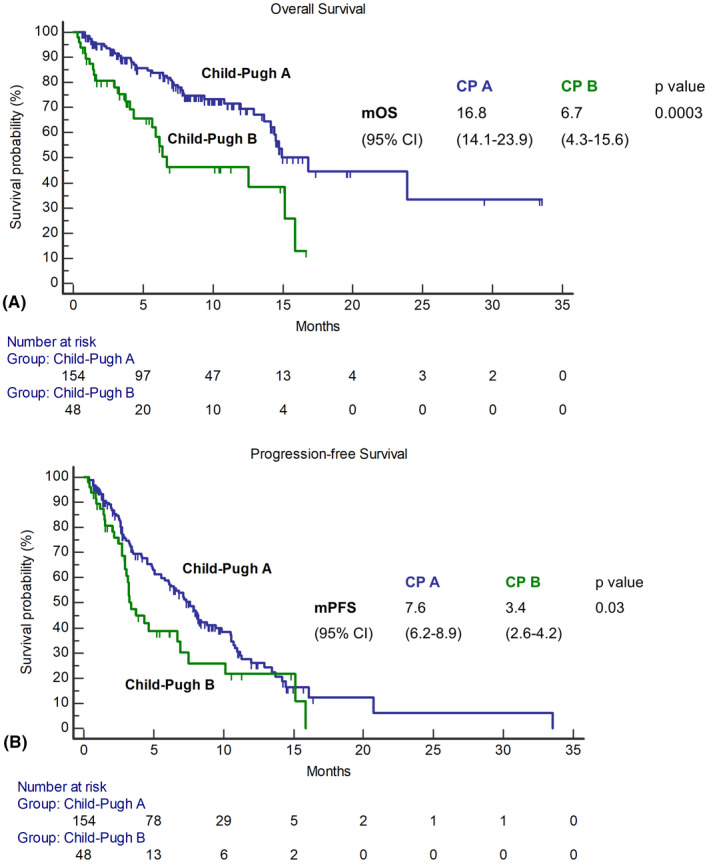
Kaplan‐Meier curves describing the OS (A) and the PFS (B) of the efficacy population stratified per CP class
Official websites use .gov
A
.gov website belongs to an official
government organization in the United States.
Secure .gov websites use HTTPS
A lock (
) or https:// means you've safely
connected to the .gov website. Share sensitive
information only on official, secure websites.
Kaplan‐Meier curves describing the OS (A) and the PFS (B) of the efficacy population stratified per CP class