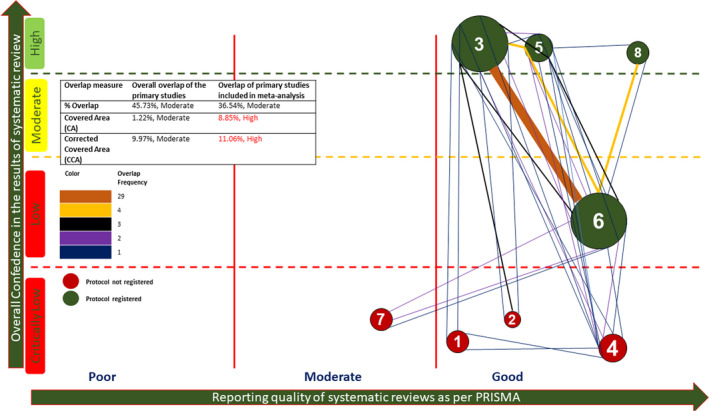
FIGURE 2.

Bubble web diagram showing the overlap of primary studies along with the quality of systematic reviews as per AMSTAR‐2, reporting characteristics as per PRISMA. The size of the bubble corresponds to the number of included studies. Color denotes the protocol registration, with a number identifying the individual review (1—De Coster et al; 2—Marghalani et al; 3—Coll et al; 4—Nematollahi et al; 5—Nuvvula et al; 6—Smaïl‐Faugeron et al; 7—Stringhini Junior et al; and 8—Jayaraman et al)
