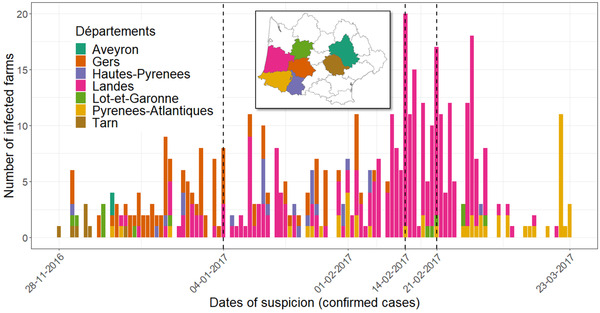
FIGURE 1.

The spatiotemporal dynamics of the 2016‐17 H5N8 epidemic in southwest France. The bars represent the daily number of infected farms identified in each département, with each département being represented by a different colour. The number of infected farms represented those that were confirmed through PCR diagnostics during the epidemic period. The dates separating the three culling phases are marked by three vertical dashed lines. Inset: Map of southwest France with each study département marked with a specific colour corresponding to the source of samples.
