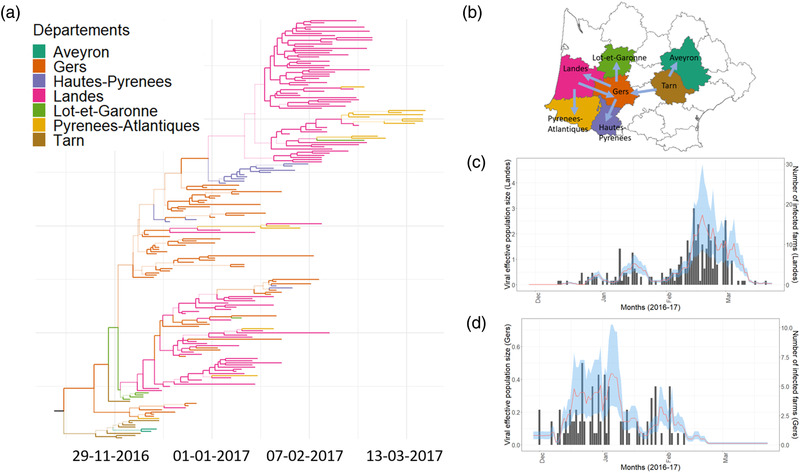
FIGURE 2.

Inferred epidemics dynamics based on structured coalescent population model. (a) A time‐scaled maximum clade credibility (MCC) phylogenetic tree representing the evolutionary relationship between viral lineages. The colour of a branch indicates the inferred location (see legend) with the highest posterior support. A colour change on a branch indicates a virus spread event. Numbers of all the nodes are shown in the supplementary figure; (b) A schematic of the prominent (maximum probability of inferred location > 0.7) viral spread events between départements. (c) Estimates of viral effective population size (line in red; 95% highest posterior density; HPD in blue) and the time series of the infected number of farms in Landes (black bar chart), the most affected département. (d) Estimates of viral population size (line in red; 95% HPD in Blue) and the time series of the infected number of farms in Gers (black bar chart), the second most affected département
