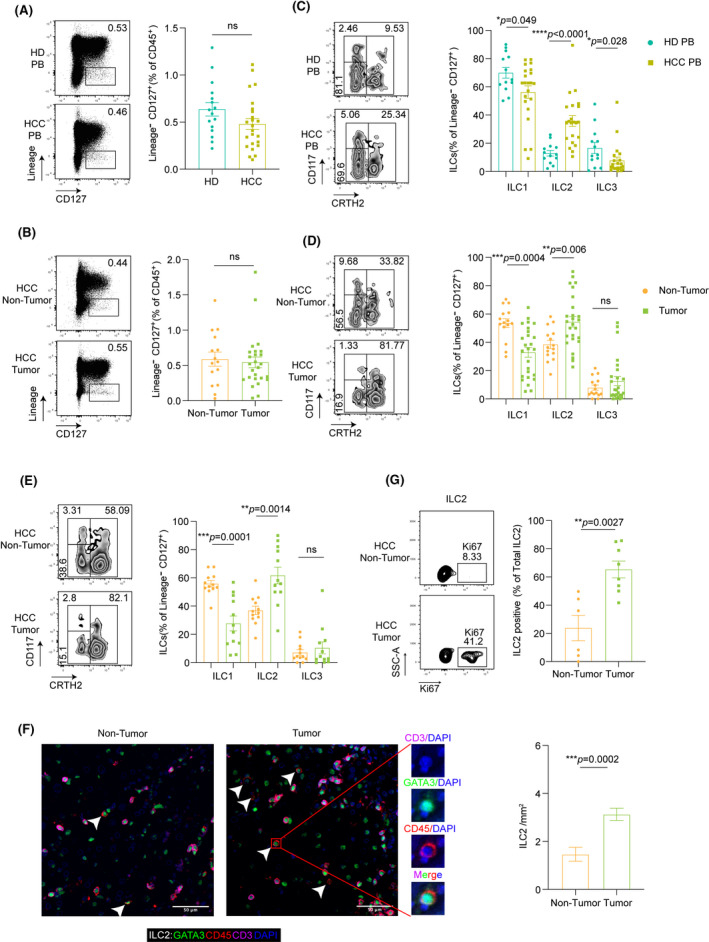
FIGURE 1.

ILC2s are dramatically increased in human HCC. (A) Flow cytometry analysis of representative cases of CD45+LIN−CD127+ ILCs in the PB of healthy donors (HD) and patients with HCC. Frequencies of total ILCs in HD (n = 16) and HCC (n = 24) relative to the CD45+ lymphocytes (p = 0.1). (B) Flow cytometry analysis of representative cases of ILCs in nontumor tissues (N), tumor (T) of HCC. Frequencies of total ILCs in N (n = 15), and T (n = 26) relative to the CD45+ lymphocytes (p = 0.72). (C) Flow cytometry analysis of representative cases of ILC subsets (ILC1, ILC2, and ILC3) in the PB of HD and HCC. Relative frequencies of CD161+CD117−CRTH2− ILC1, CD161+CD117+/− CRTH2+ ILC2, CD161+ CD117+ CRTH2− ILC3 in HD (n = 13) and HCC (n = 22) relative to the total ILCs. (D) Flow cytometry analysis of representative cases of ILC subsets (ILC1, ILC2, and ILC3) in N and T tissues of HCC. Frequencies of ILC subsets in tumor (n = 26), nontumor tissues (n = 15) relative to the total ILCs. (E) Flow cytometry analysis of representative cases of ILC subsets in paired tissue samples of patients with HCC. Frequencies of ILC subsets in tumor, paired nontumor tissues (n = 12) relative to the total ILCs. (F) Percentages of Ki‐67–expressing ILC2s in tumor (n = 8), nontumor tissues (n = 6) of HCC. (G) Representative example of ILC2s in HCC tissues (n = 12) stained by fluorescent multiplex immunohistochemistry showing expression of CD3 (purple), CD45 (red), GATA3 (green), and DAPI (blue) (left panel). Scale bars: 50 μm. Summary of density information for CD3−CD45+GATA3+ ILC2s in paired nontumor and tumor tissues (right panel). Lines and error bars are presented as mean ± SEM. *p < 0.05, **p < 0.01, and ***p < 0.001, ****p < 0.0001. All statistical analyses were performed with the Mann‐Whitney U test for (A–D, G) and Wilcoxon rank‐sum test for (E, F)
