
FIGURE 5.
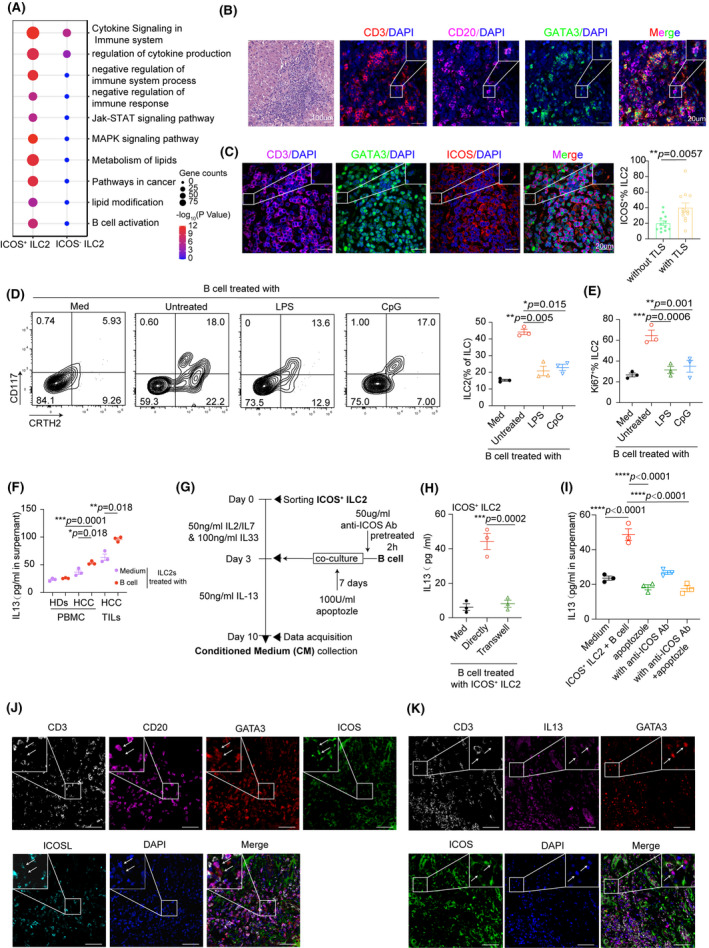
ICOS–ICOSL axis–enhanced IL‐13 production in ILC2 cells elicited by B cells. (A) GO Biological Process enrichment plot for clusters of ICOS‐positive versus ICOS‐negative among ILC2a cells. (B) H&E and immunofluorescence analysis of CD3+ T cells (red), CD20+ B cells (purple), and CD3−GATA3+ ILC2 cells (green) in TLS. Results represent three independent experiments (n = 8). Scale bar, 20 μm. (C) Representative immunofluorescence images of ICOS+ ILC2 cells in and out of TLS. Scale bars, 20 μm. Percentage of ICOS+ ILC2 cells in HCC tissues with or without TLS (n = 12 per group). (D) Purified naïve B cells were left untreated or were stimulated with LPS or CpG‐DNA ODN (CpG) for 18 h and then cocultured with autologous ILC cells at a ratio of 1:1 for 7 days. Quantitation of the percentage of ILC2 cells in the total CD127+ ILC cells before and after B cell treatment. (E) Expression of Ki‐67 of ILC2 cells with indicated treatments were detected by FACS. (F) IL‐13 concentration in CM of ILC2 cells or plus B cells from PBMCs and TILs in patients with HCC was measured by ELISA assay. PBMCs of healthy donors were served as control. (G) B cells were pretreated with ICOS‐neutralizing antibody (50 μg/ml) or isotype and then cultured alone or with autologous ICOS+ ILC2 cells from HCC PBMCs in the presence or absence of apoptozole (100 U/ml) as indicated in the workflow. (H) Quantitative analysis of IL‐13 levels in ICOS+ ILC2 subsets after cultured for 7 days in medium or with B cells directly or in a Transwell chamber by ELISA. (I) Analysis of IL‐13 levels in ICOS+ ILC2 subsets cultured alone or stimulated with B cells, ICOS Abs, apoptozole, or both from HCC PBMCs for 7 days. Data are presented as means ± SEM (C to I). (J) Representative immunofluorescence images of ICOS+ILC2 cells and ICOSL+B cell. Scale bars, 50 μm (n = 4). (K) Representative immunofluorescence images of ICOS+ILC2 cells secreting IL‐13. Scale bars, 50 μm (n = 4). *p < 0.05, **p < 0.01, ***p < 0.001, ****p < 0.0001. Student t test for C; rank‐transformed one‐way ANOVA combined with multiple comparison for (D, F); one‐way ANOVA combined with multiple comparison for (E, H, I)