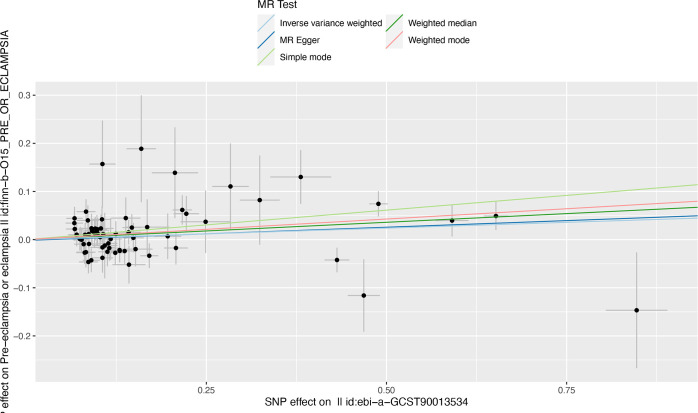
Figure 5.
Scatter plot illustrating the distribution of individual ratio estimates of RA with pre-eclampsia as the outcome. Trend lines derived from five different MR methods indicate cause and effect. Inverse variance weighted(light blue), Weighed median(dark green), MR Egger(dark blue), weighted mode(red), Simple mode(light green); SNP, single-nucleotide polymorphism; RA, rheumatoid arthritis; MR, mendelian randomization.

