Figure 5.
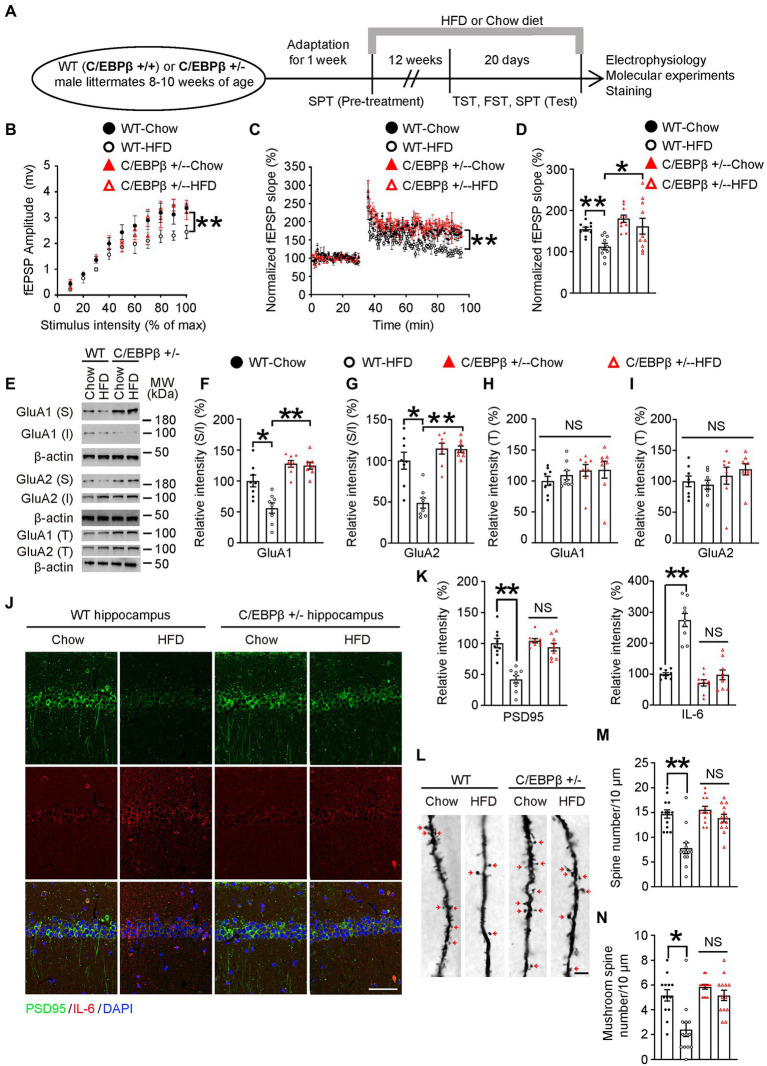
Genetic knockdown of CEBPB represses HFD-induced synaptic plasticity impairment and alleviates neuro-inflammation in the hippocampus. (A) Schematic of the HFD or chow diet course and behavioral tests process. (B) Input/output curves illustrating the relationship between the magnitudes of stimulation and evoked response for field excitatory postsynaptic potentials (fEPSPs) recorded in hippocampal slices from wild-type-Chow, wild-type-HFD, C/EBPβ +/−-chow and C/EBPβ +/−-HFD mice. Data represent the mean ± SEM (n = 8–10 for each group; **p < 0.01; two-way ANOVA and Bonferroni’s multiple comparison test). (C) LTP induced by HFD in hippocampal slices from different groups. Data represent the mean ± SEM (n = 8–10 for each group; **p < 0.01; two-way ANOVA and Bonferroni’s multiple comparison test). (D) Histogram showing LTP magnitude averaged from the last 15 min of recordings from in the different groups. Data represent the mean ± SEM (n = 8–10 per group; *p < 0.05, **p < 0.01; one-way ANOVA and Bonferroni’s multiple comparison test). (E–I) Representative immunoblots and quantification of GluA1 (S), GluA1 (I), GluA1 (T), GluA2 (S), GluA2 (I), and GluA2 (T) protein expression in the hippocampus in HFD- or chow diet-fed mice. Data are representative of three independent experiments (E). Data in (F) represent mean ± SEM (n = 8 for each group; *p < 0.05, **p < 0.01; one-way ANOVA and Bonferroni’s multiple comparison test). Data in (G–I) represent the mean ± SEM (n = 8 for each group; *p < 0.05, **p < 0.01; NS, not significant; one-way ANOVA and Bonferroni’s multiple comparison test). S, surface; I, intracellular; T, total. (J) Immunofluorescent co-staining of PSD95 and IL-6 in FIGURE 5 (Continued)hippocampal sections of the above mice. Scale bar: 50 μm. (K) Quantification of PSD95 and IL-6 immunofluorescence signals. Data in (K) represent the mean ± SEM (n = 9 for each group; **p < 0.01; NS, not significant; one-way ANOVA and Bonferroni’s multiple comparison test). (L) Golgi staining showing the dendritic spines and mushroom spines from the apical dendritic layer of the hippocampus. (M,N) Quantification of dendritic spines and mushroom spines. Arrows indicate mushroom spines. Scale bar: 10 μm. Data represent the mean ± SEM (n = 13 for each group; **p < 0.01; NS, not significant; one-way ANOVA and Bonferroni’s multiple comparison test).

