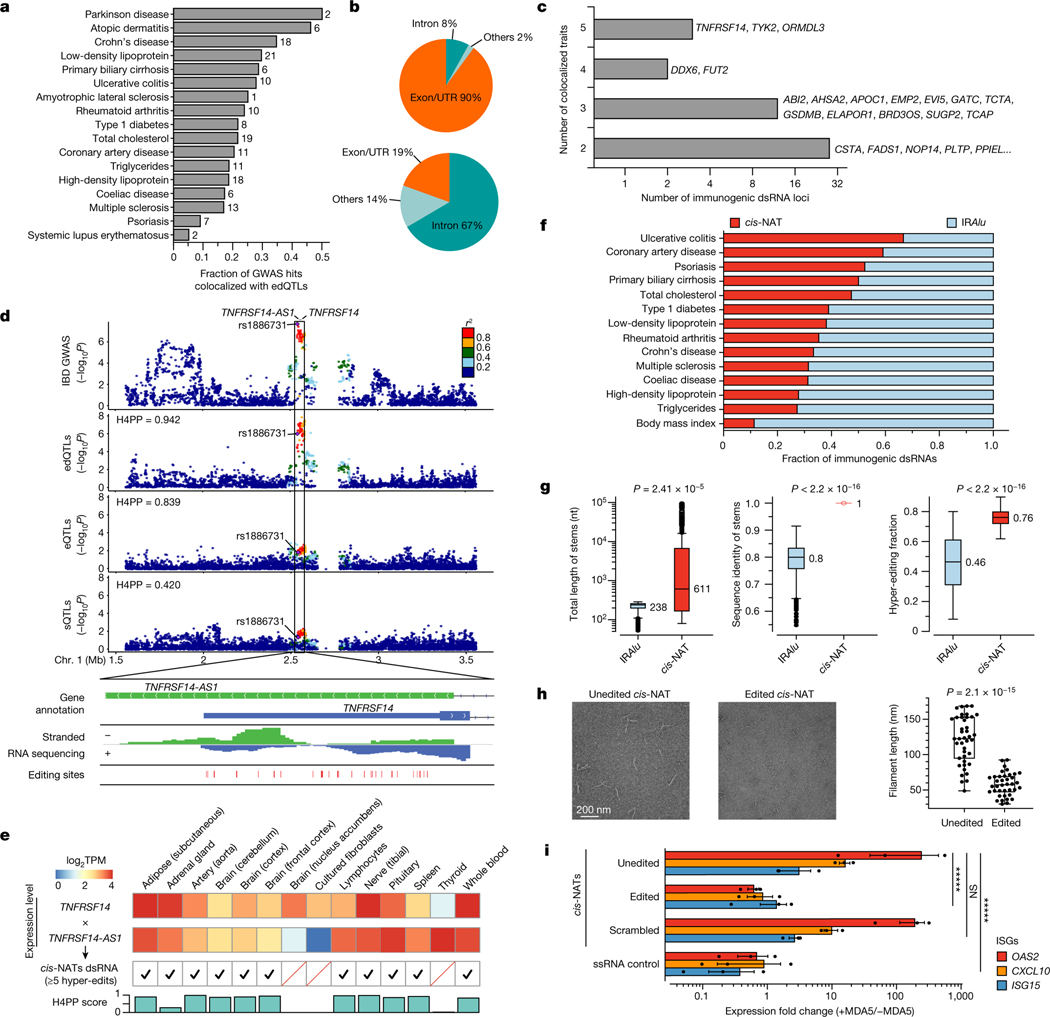
Fig. 3 |. Identification, characterization and validation of disease-relevant, putatively immunogenic dsRNAs.
a, Fractions of GWAS loci explained by edQTLs. The total number of colocalized loci is shown for each disease. b, Genomic distribution of putatively immunogenic dsRNAs (top) and all dsRNAs with edSites (bottom). c, Putatively immunogenic dsRNAs colocalized with multiple diseases. d, Top dsRNA loci colocalized with IBD GWAS with QTL signals shown below (top). Evidence supporting dsRNA formation by cis-NATs shown in the top panel is also displayed (bottom). Bidirectional transcription is supported by gene annotation (top row) and by stranded RNA sequencing (middle row). The formation of dsRNA is supported by hyper-editing (bottom row). H4PP, H4 posterior probability. e, Validation of cis-NAT dsRNA formation in GTEx tissues. Expression levels are shown for tissues with one or more cis-NAT genes expressed. The formation of dsRNA is verified by hyper-editing. H4PP scores are shown for colocalization between edQTL and GWAS. TPM, transcripts per million. f, Fraction of IRAlu or cis-NAT dsRNAs colocalized with immune-related diseases. Data for body mass index are shown as a control. g, Comparative analysis of IRAlu and cis-NAT dsRNAs in three dsRNA features key to MDA5 sensing using two-sided Mann–Whitney U-test. h, Negative-stain electron microscopy images of the MDA5 filaments along the unedited (left) and edited (middle) cis-NAT dsRNAs. Comparison of filament length using two-sided unpaired Student’s t-test is also shown (right). Points are biologically independent filaments. i, Real-time PCR measurements of representative ISGs in ADAR1E912A cells, transfected with plasmids expressing CSTA–PLTP cis-NAT dsRNA (unedited), CSTA–PLTP cis-NAT dsRNA with scrambled sequences (scrambled) or single-stranded RNA (ssRNA control). cis-NAT dsRNAs were also expressed in ADAR1WT cells (edited). Expression fold changes were calculated by the ratio between cells with and without doxycycline-inducible MDA5 (+MDA5 and −MDA5, respectively). n = 3, *****P < 0.00001; not significant (NS) P > 0.5 (two-sided Wilcoxon signed-rank test). The error bars represent the standard error with the centre as the mean. Box plots in g and h show interquartile ranges and the median, with whiskers extending to minima and maxima.

