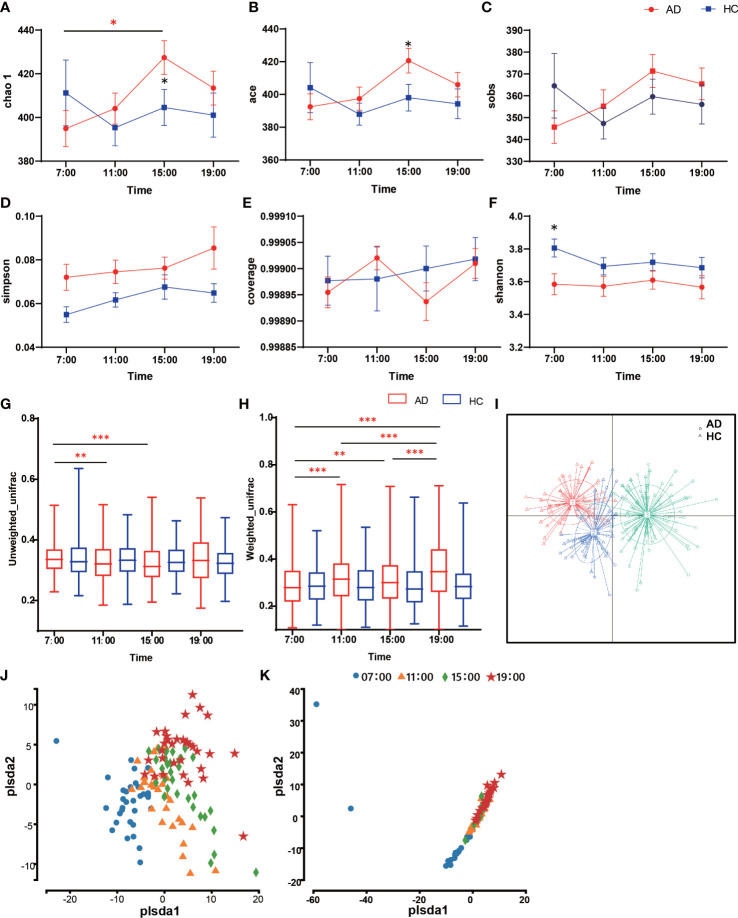
Figure 1.
Diversity of salivary microbiota in the AD and HC groups. (A-F) The differences in α-diversity in salivary microbiota between AD and HC conditions at each time point (A. Chao; (B) ACE; (C) Sobs; (D) Shannon; (E) Good coverage; (F) Simpson). (G, H) Boxplots of β-diversity differences in salivary microbiota between AD and HC conditions at each time point (G). Unweighted UniFrac; (H) Weighted UniFrac). (I) Principal coordinate analysis (PCoA) of samples using Jensen-Shannon divergence (JSD). (J, I) Partial least squares discrimination analysis (PLS-DA). Points of different colors or shapes represent samples at different time points and in different groups. The scales of the horizontal and vertical axes are relative distances, which have no practical significance. The horizontal and vertical axes represent the suspected influencing factors of the microbial composition differences in the AD group (J) and HC group (K), respectively. *Wilcox test indicated significant differences between different groups at one time point, Kruskal-Wallis test indicated significant differences among four time points in either the AD or HC group. All p values are Bonferroni adjusted. * indicates p < 0.05, ** indicates p < 0.01, *** indicates p < 0.001. Data are expressed as the mean ± SEM (n=21-32).

