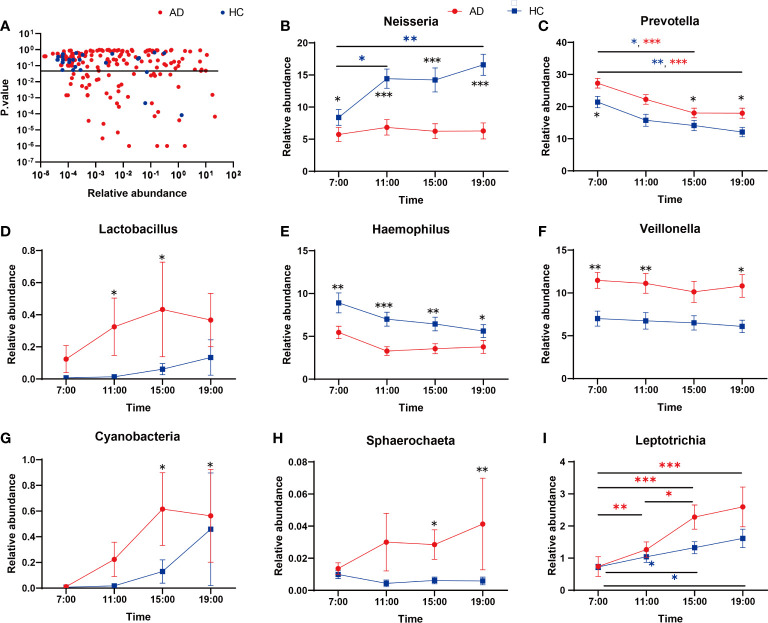
Figure 3.
(A) Genera showing variation at different time points. The Kruskal-Wallis test indicated significant differences between time points in both AD and HC. The dashed line indicates p = 0.05. (B-I) Relative abundances of significant taxa in AD and HC conditions across time points: (B) Neisseria, (C) Prevotella, (D) Lactobacillus, (E) Haemophilus, (F) Veillonella, (G) Cyanobacteria, (H) Sphaerochaeta, (I) Leptotrichia. *Wilcox Test indicated significant differences between different groups at one time point, Kruskal-Wallis test indicated significant differences between time points in either AD and HC. All p values are Bonferroni adjusted. * indicates p < 0.05, ** indicates p < 0.01, *** indicates p < 0.01. Data are expressed as the mean ± SEM (n=21-32).

