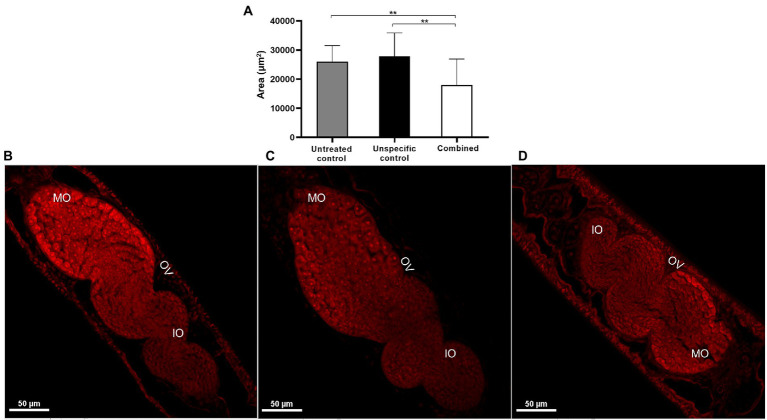
Figure 10.
Phenotypic changes in female adult worms recovered from mice infected with SmHGPRTases knocked-down schistosomula. (A) Bars representing the ovary area of female adult worms from the untreated control (gray), unspecific control (black), and combined SmHGPRTases group (white). Above the bars are represented the standard error of the mean of three replicates. After verifying the normality using the Shapiro–Wilk test, significant differences compared to controls were analyzed by unpaired t-test (**p ≤ 0.01). (B–D) Representative confocal images demonstrating female adult worms recovered from the untreated control (B), unspecific control (C), and the combined SmHGPRTases group (D). MO, mature oocyte; IO, immature oocyte; OV, ovary. Scale bars: 50 μm.

