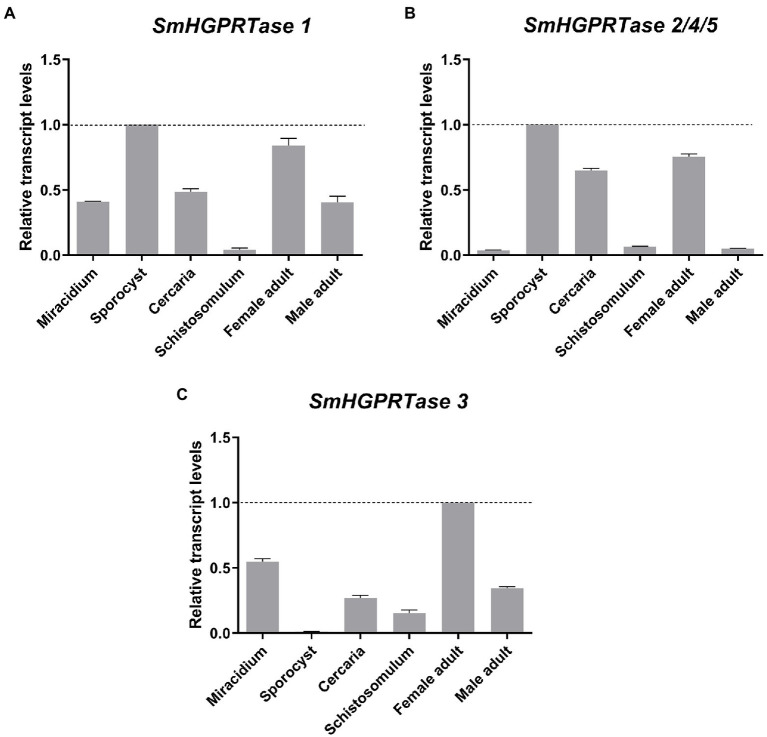
Figure 4.
Expression profile of SmHGPRTases throughout different parasite’s life stages. Bars showing the relative transcript levels of SmHGPRTase 1 (A), SmHGPRTase 2/4/5 (B), and SmHGPRTase 3 (C) in the different S. mansoni life stages: miracidium, sporocyst, cercaria, schistosomulum, male, and female adult worm. (A,B) Data were normalized relative to the sporocyst stage (dashed line). (C) Data were normalized relative to the female adult worm stage (dashed line).

