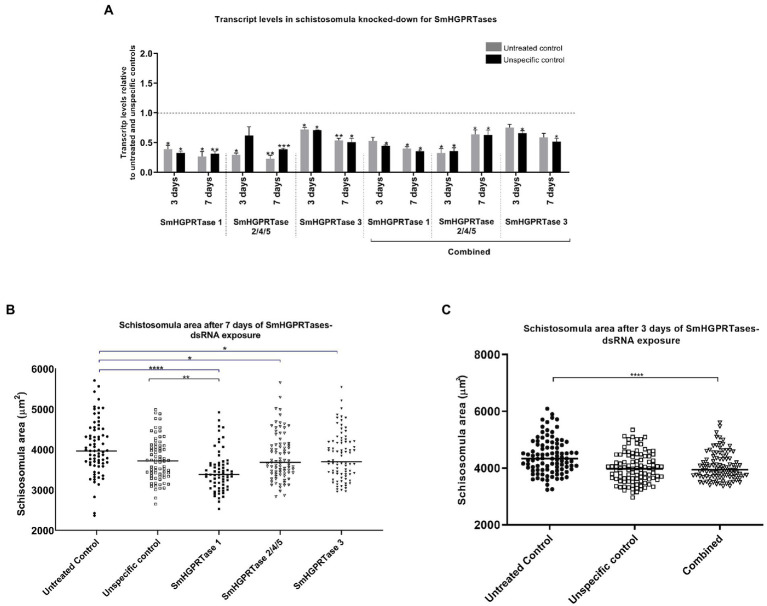
Figure 7.
SmHGPRTases transcript levels and area of schistosomula after exposure to dsRNAs. (A) Bars representing the transcript levels of SmHGPRTase 1, SmHGPRTase 2/4/5, and SmHGPRTase 3 in schistosomula after exposure to the specific dsRNAs separately or in combination (combined) relative to the untreated (gray) or unspecific control (black) after 3 and 7 days. Above the bars are represented the standard error of the mean of three replicates. After verifying the normality using the Shapiro–Wilk test, significant differences compared to control conditions were analyzed by unpaired t-test. (B) Area (μm2) of schistosomula exposed to the SmHGPRTases-dsRNAs after 7 days. Symbols represent a single parasite for each experimental group. Black circles, untread control; White squares, unspecific control; Black square, parasites treated with SmHGPRTase 1-dsRNA; White triangles, parasites treated with SmHGPRTase 2/4/5-dsRNA; Black triangles, parasites treated with SmHGPRTase 3-dsRNA. (C) Area (μm2) of schistosomula exposed to the combined group after 3 days. Symbols represent a single parasite for each experimental group. Black circles, untread control; White squares, unspecific control; White triangles, combined group. The horizontal black lines represent the median area of the sample population. After verifying the normality using the D’Agostino-Pearson test, significant differences compared to control conditions were analyzed by unpaired t-test (*p ≤ 0.05; **p ≤ 0.01; ***p ≤ 0.001; ****p < 0.0001).

