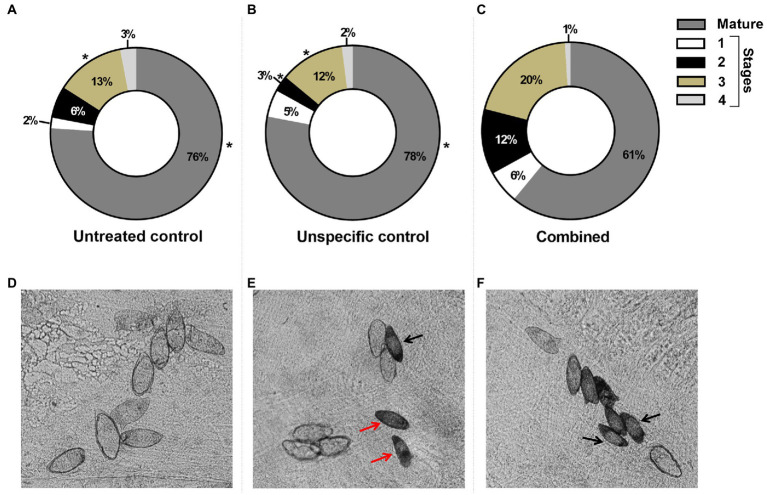
Figure 9.
Egg maturation in the ileum of mice infected with schistosomula exposed to the dsRNAs of the five SmHGPRTases combined. The percentage of eggs in each maturation stage is represented in the circle section: mature (gray), stage 1 (white), stage 2 (black), stage 3 (beige), and stage 4 (light gray) for the untreated control group (A), GFP-dsRNA unspecific control (B), and the combined group (C). After verifying the normality using the Shapiro–Wilk test, significant differences compared to control conditions were analyzed by unpaired t-test (*p ≤ 0.05). (D–E) Representative images of the maturation pattern in each experimental group. Black arrow, eggs in stage 2; Red arrow, eggs in stage 3.

