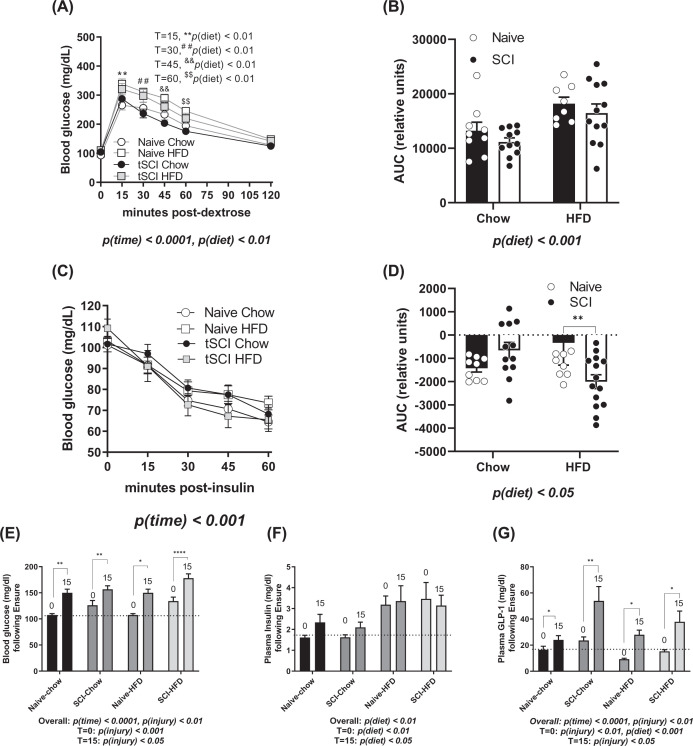
Figure 2. Whole body glycemic measurements.
(A) Blood glucose measurements from the GTT using 1.5 mg/kg dextrose injected intraperitoneally after fasting bleed at T = 0. T=15, **P(diet)< 0.01, T=30, ##P(diet)< 0.01, T=45,&&P(diet)< 0.01, T=60, $$P(diet)< 0.01.(B) Area under the curve (AUC) for GTT shown in (A). (C) Blood glucose measurements following insulin tolerance test. (D) AUC for ITT shown in panel (C). (E) Blood glucose at 0 and 15 min following mixed nutrient ENSURE gavage. (F) Insulin measurements from blood samples following ENSURE gavage. (G) Total GLP-1 levels measured from blood samples obtained before and after ENSURE gavage. Data are presented as mean ± SEM. Statistical significance was determined with three‐way analysis of variance for main effects. N = 9–11/group; *P<0.05, **P<0.01, ***P<0.001. Analysis of each time point was determined by two-way analysis of variance for main effects. *P<0.05, **P<0.01. Pre- and post-gavage analyses were performed using Student’s t-test; *P<0.05, **P<0.01, ****P<0.0001.

